
References & industries
Several hundred plants since 2016 — sold almost entirely by referral. Here are the companies, the measured results and real installation photos from every plant.
several hundred
plants since 2016
0
damage claims — confirmed by Allianz
0.54 yrs
fastest documented payback (hospital, 2026)
10–17 %
measured fuel savings
Several hundred plants, one story
Recording coming soon
Names you know
Companies with foresight that use Intensatec.
An excerpt from our reference list (Germany, as of 2026) — companies whose boiler plants run with Intensatec high-temperature ceramics. Out of discretion, measured savings are shown separately, anonymised by industry.
BMW Niederlassung
Automotive
Bayerischer Rundfunk
Media & broadcasting
Ardagh
Packaging industry
Maritim Hotels
Hotels
Procter & Gamble
Consumer goods
MEDIAN Kliniken
Hospital group
MAHLE
Automotive supplier
St. Franziskus-Stiftung
Hospitals & care
erlenbacher
Industrial bakery
Asklepios Kliniken
Hospital group
LMU Klinikum
Großhadern university hospital
Ottobock
World market leader in prosthetics
Coppenrath & Wiese
Market leader in frozen bakery products (DE)
Deutsche Telekom
Telecommunications
Dräxlmaier
Automotive supplier
Dentsply Sirona
Dental technology
Westpfalz-Klinikum
Hospital
Kinderhospital Osnabrück
Children's hospital
For data-protection reasons, contact with our references is provided only on request and by prior arrangement.
Industry groups
Physics works across every industry.
In 100 % of documented cases the real savings in live operation exceeded the conservative forecasts. Validated across more than 25 industries — from pharma logistics to heavy industry.
Industry, metal & automotive
Automotive · metal processing · sheet-metal work · forming technology · industrial groups · building components · manufacturing
10.43 %
Ø forecast
15.43 %
Ø measured
Hospitals, pharma & health
Hospitals & health · pharma logistics · medical and dental technology
9.33 %
Ø forecast
14.20 %
Ø measured
Consumer goods, chemicals & food
Food & industrial bakeries · consumer goods · textiles · chemicals and paints · wood processing
11.20 %
Ø forecast
18.36 %
Ø measured
Hospitality & leisure
Hospitality · spas and public pools · health & fitness
9.67 %
Ø forecast
15.34 %
Ø measured
Infrastructure, energy & logistics
Energy supply · wholesale and logistics · facility management · telecommunications · media & broadcasting
10.60 %
Ø forecast
15.86 %
Ø measured
Measured, not promised
Forecast → measured result.
The full anonymised comparison across more than 25 industries: the deliberately conservative forecast from the quotation on the left, the later measured result on the right. In 100 % of documented projects the forecast was exceeded.
Hospitals & health
10 %→14.21 %
forecast → measured
Automotive
12 %→+17.0 %
forecast → measured
Hospitality
10 %→14.71 %
forecast → measured
Medical technology (dental)
10 %→16.52 %
forecast → measured
Metal processing
10 %→15.76 %
forecast → measured
Sheet-metal processing
10 %→15.75 %
forecast → measured
Forming technology
10 %→15.33 %
forecast → measured
Spas & pools
10 %→14.98 %
forecast → measured
Facility management
9 %→14.76 %
forecast → measured
Textile industry
10 %→14.56 %
forecast → measured
Manufacturing
9 %→13.80 %
forecast → measured
Health & fitness
9 %→16.34 %
forecast → measured
Energy supply
8 %→12.50 %
forecast → measured
Pharma logistics
8 %→11.88 %
forecast → measured
Food (industrial bakery)
8 %→11.22 %
forecast → measured
Wood processing
14 %→+17.0 %
forecast → measured
Building components
10 %→+17.0 %
forecast → measured
Paints & coatings
12 %→+17.0 %
forecast → measured
Drive technology
12 %→+17.0 %
forecast → measured
Wholesale
12 %→+17.0 %
forecast → measured
Consumer goods
12 %→+17.0 %
forecast → measured
Industrial corporation
12 %→+17.0 %
forecast → measured
Media & broadcasting
12 %→+17.0 %
forecast → measured
Telecommunications
12 %→+17.0 %
forecast → measured
Industries
Your industry, your numbers.
Measured benchmarks from the reference projects. Open your industry for worked examples, typical plants and details.
Every industry has its own page with a worked example, typical plants and the measured benchmark:
Proof
Measured, not promised.
15.22 %
measured against a 12 % forecast — hospital, July 2026 (boilers built 1991): €118,890 saved per year, payback 0.54 years
19.69 %
measured against a 10 % forecast — automotive branch, April 2026, on a condensing boiler already at 99 % efficiency
11.78 %
measured against an 8 % forecast — Viessmann Vitoplex 300 protocol (2022), payback 0.65 years
> 500,000
data records from the 2019–2021 long-term study: identical boilers compared — the 10 % forecast was consistently exceeded over two years
In 100 % of documented cases, the forecast given beforehand was exceeded by the later measurement. Our forecasts are deliberately conservative — so the number in the quotation is the number you can rely on.
How we do it
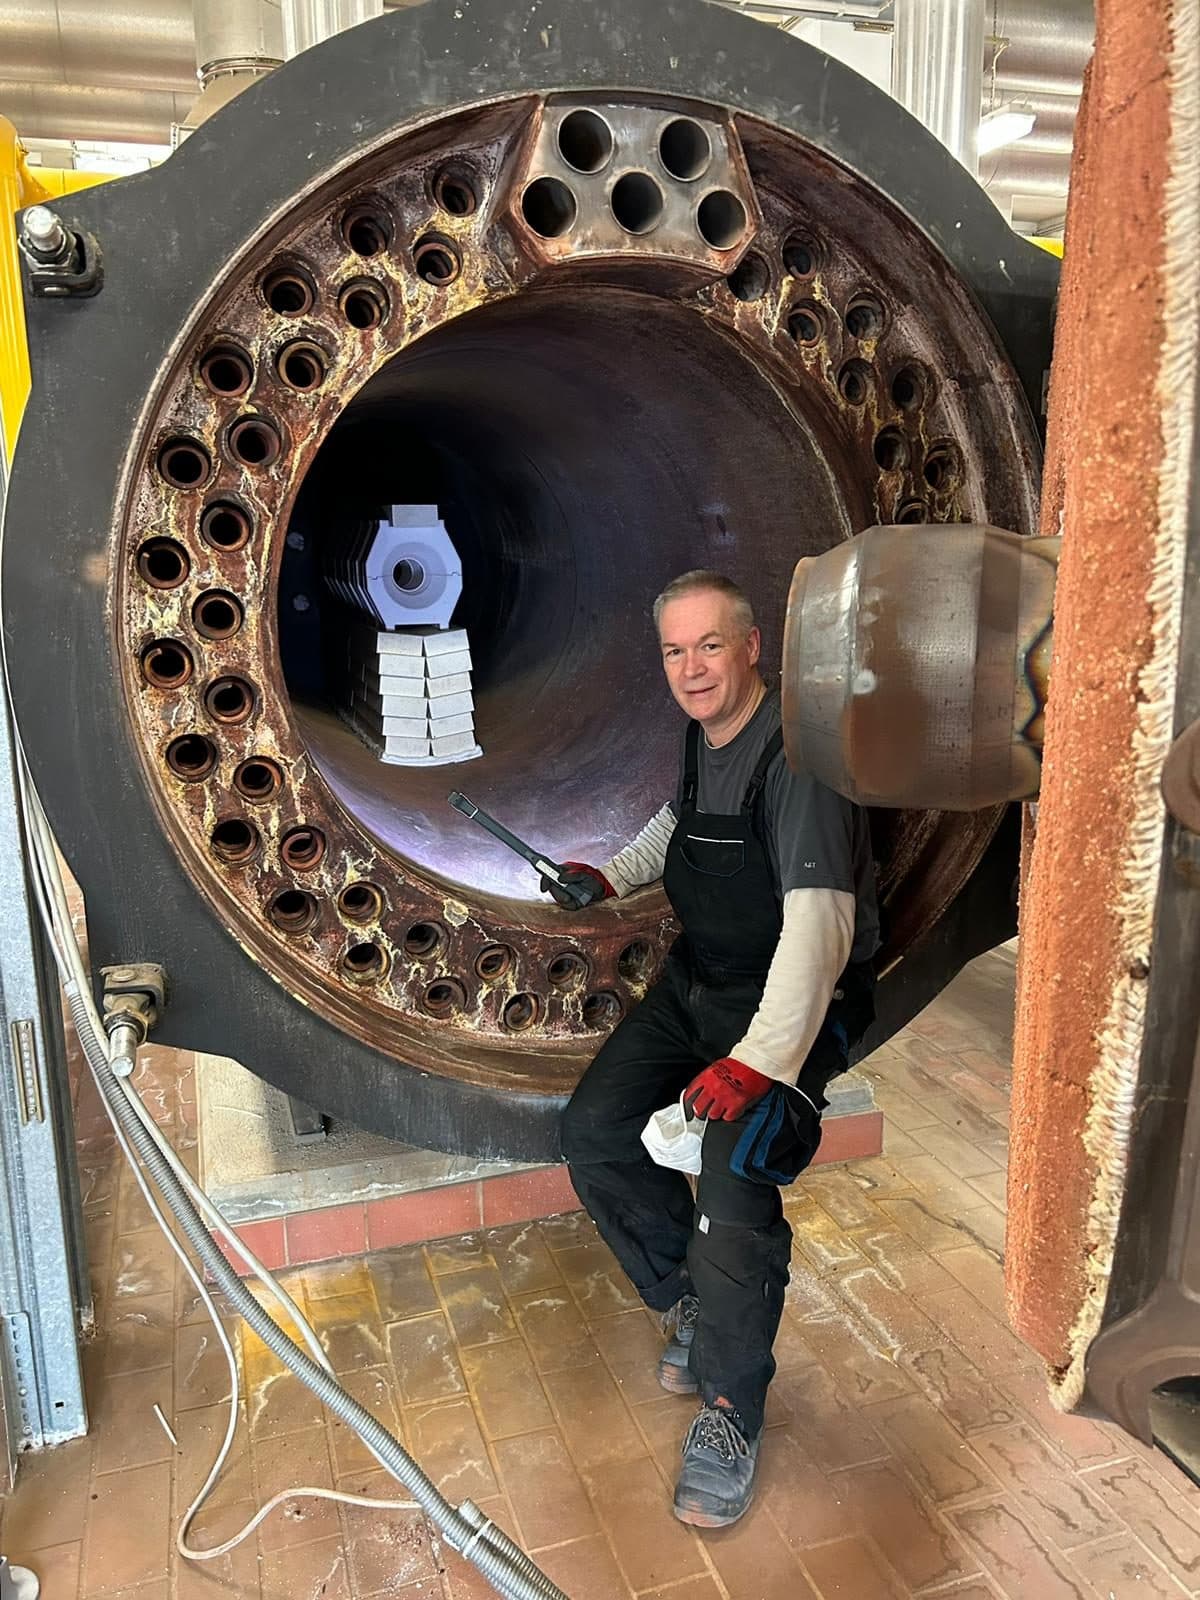
An installation in pictures — two boilers, two days.
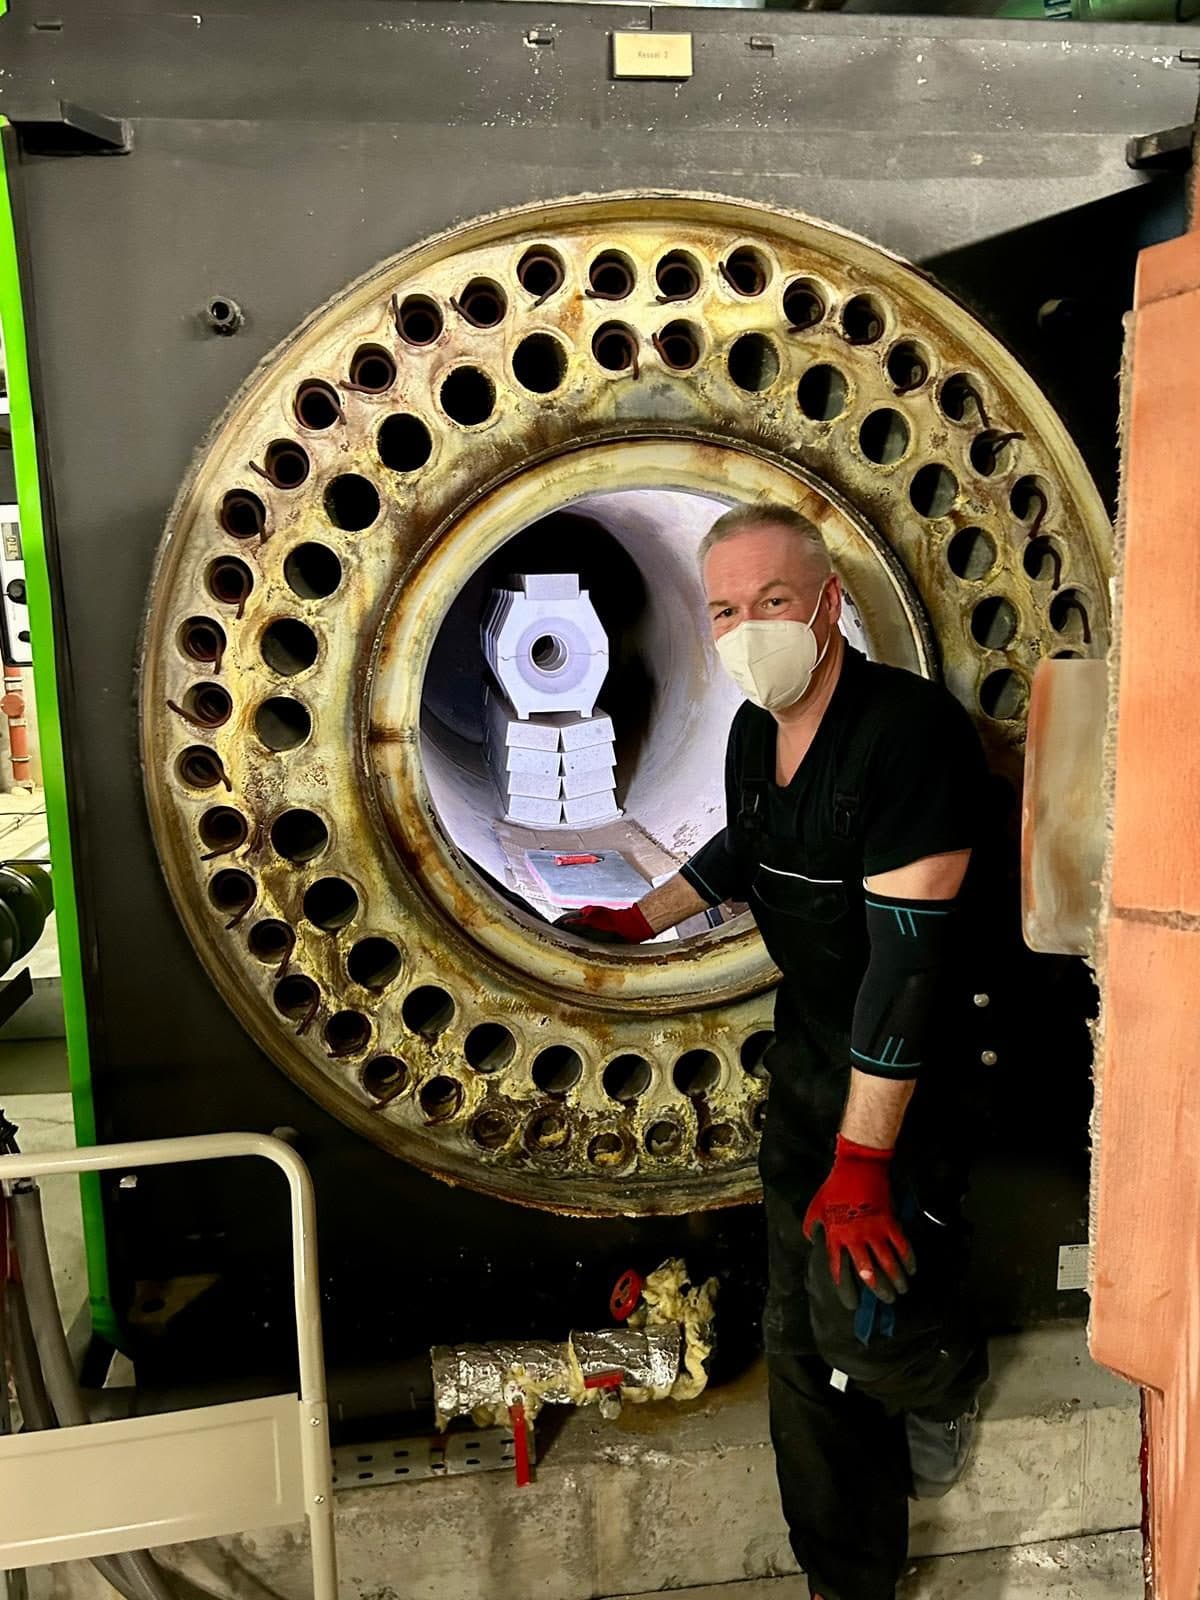
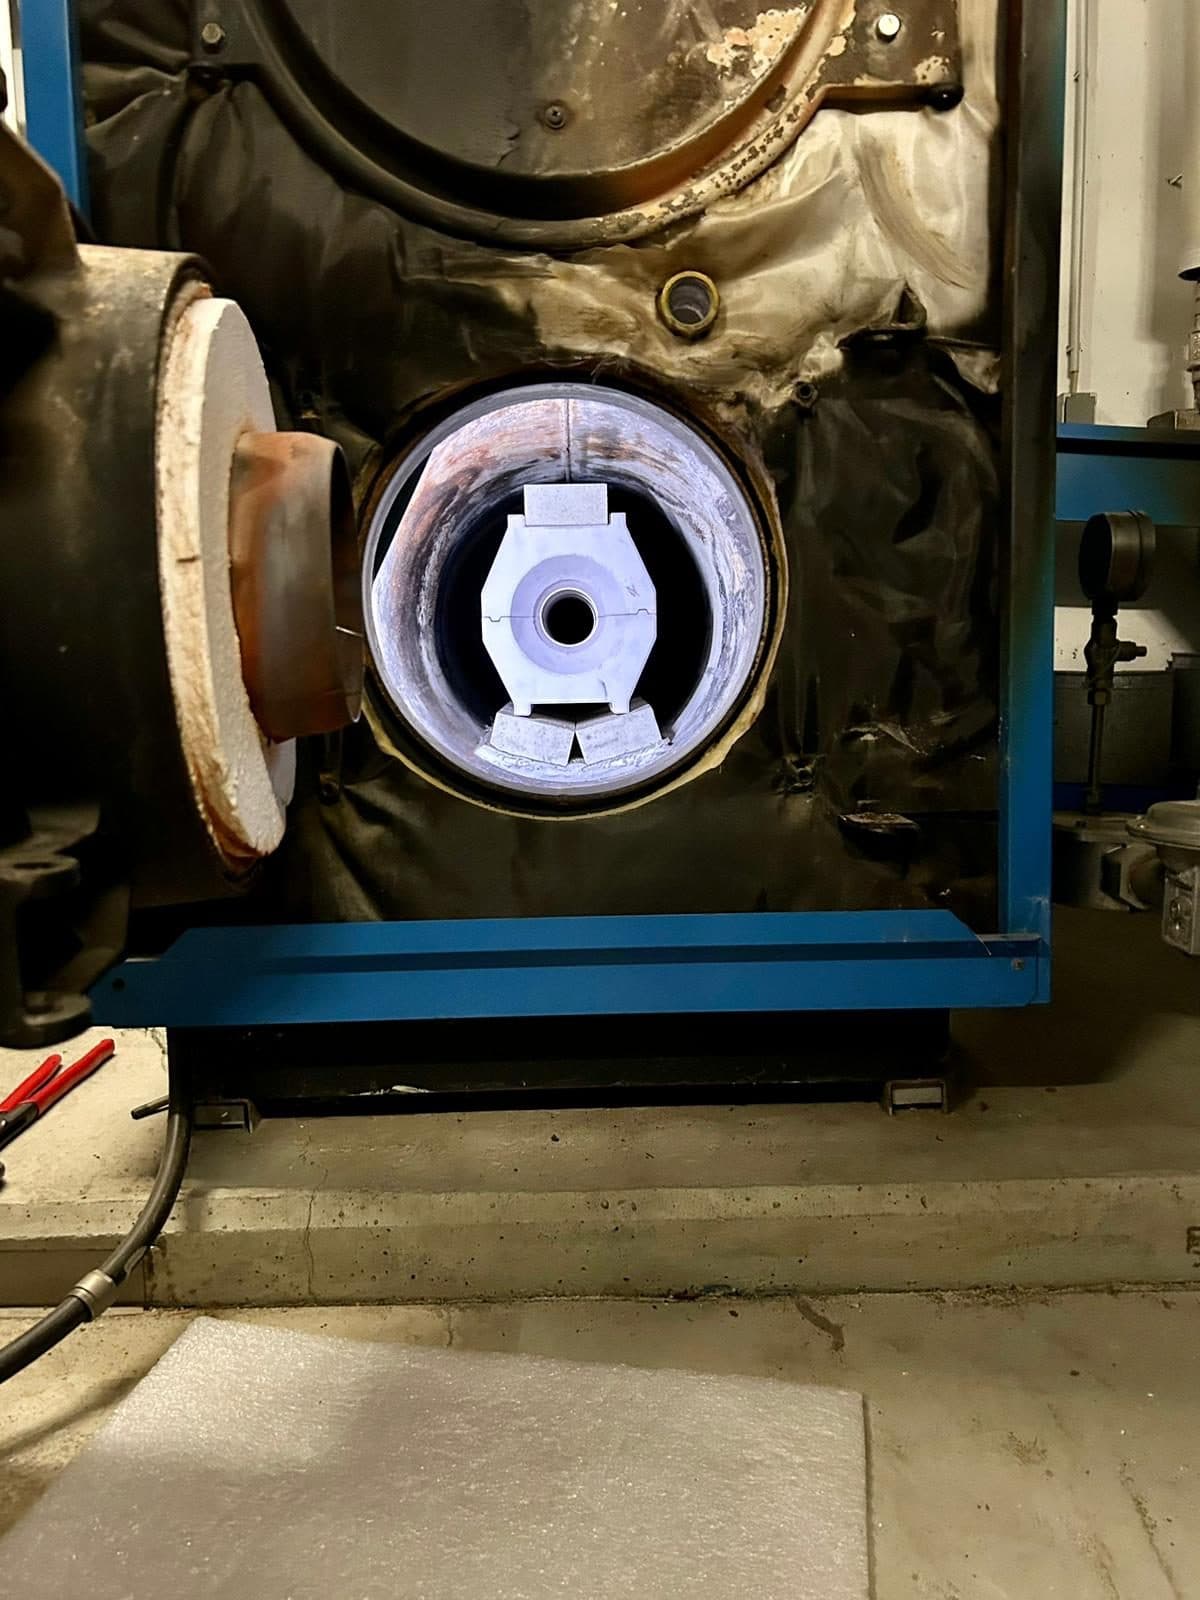
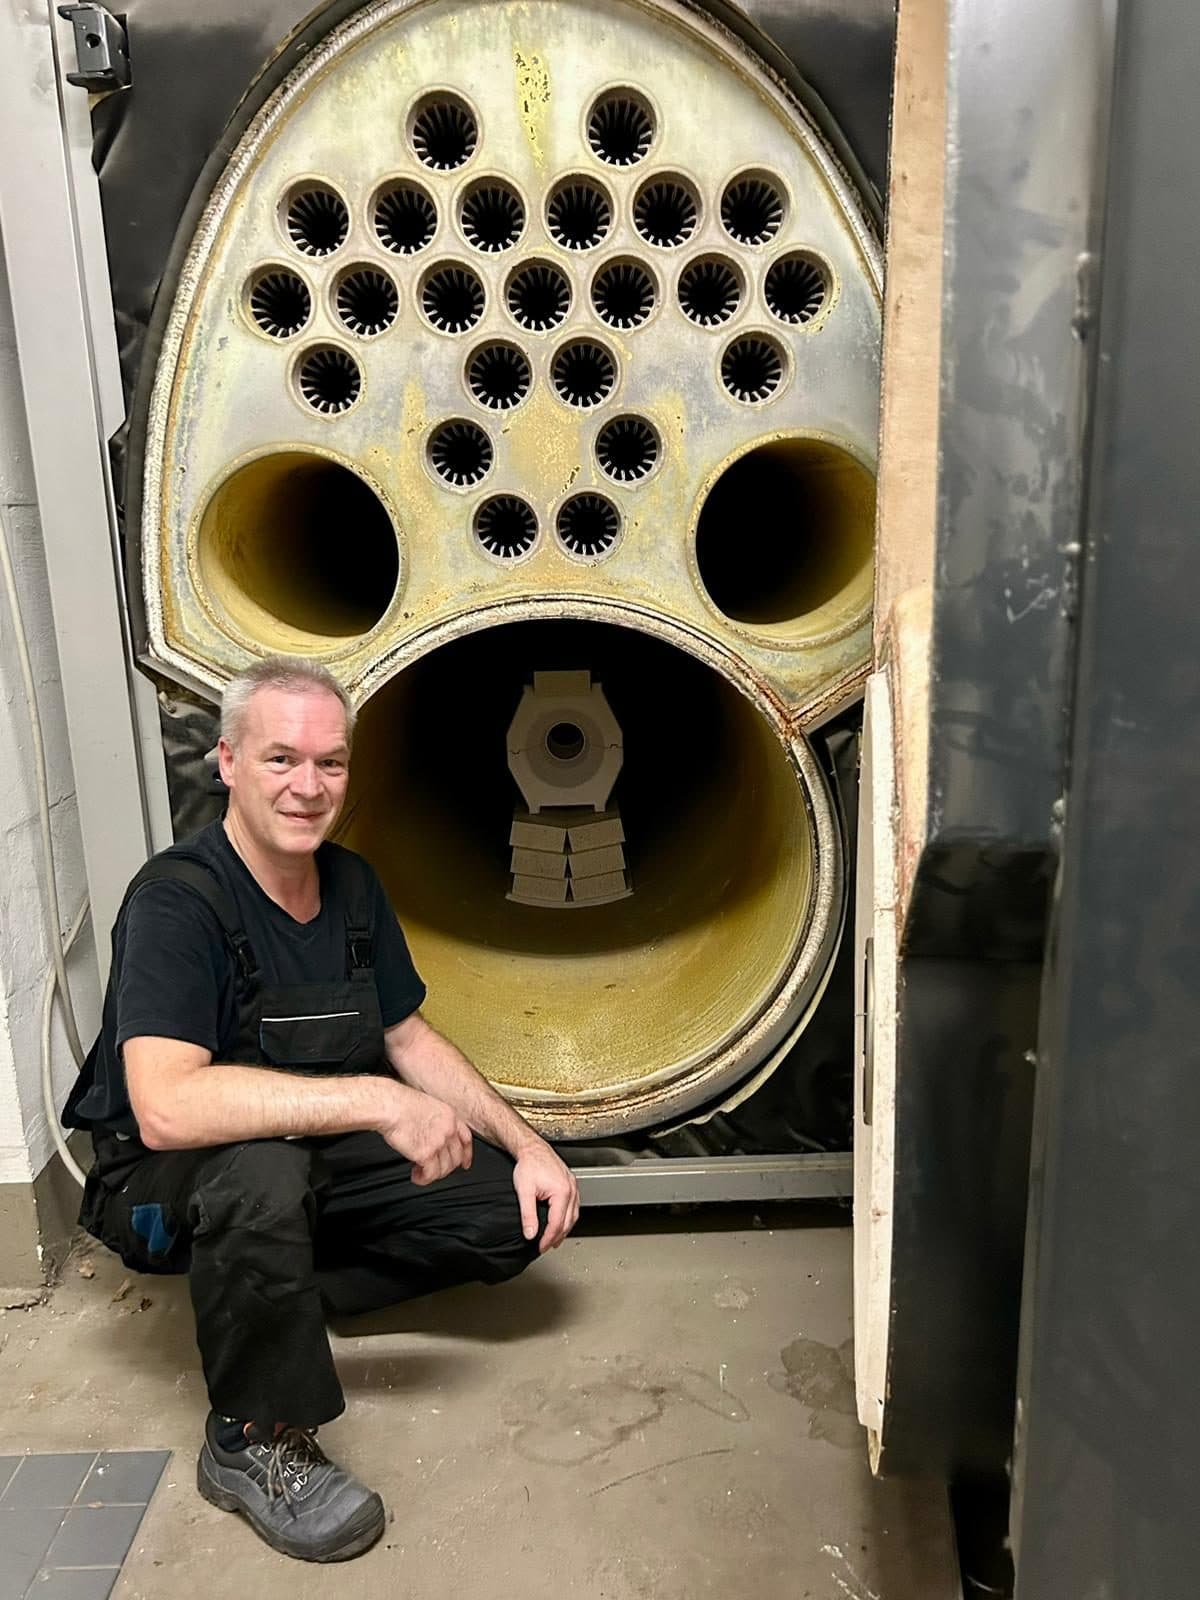
Hospital, July 2026: two large boilers (built 1991) receive the Intensatec high-temperature ceramics — documented from first opening to final sign-off. No conversion, no intervention in the boiler: the ceramic elements are placed, aligned, done.
 Start
Start 1
1 2
2 3
3 4
4 5
5 6
6 7
7 8
8 9
9 10
10 11
11 12
12 13
13 14
14 15
15 16
16 17
17 18
18 19
19How we measure
Traceable down to the cubic metre.
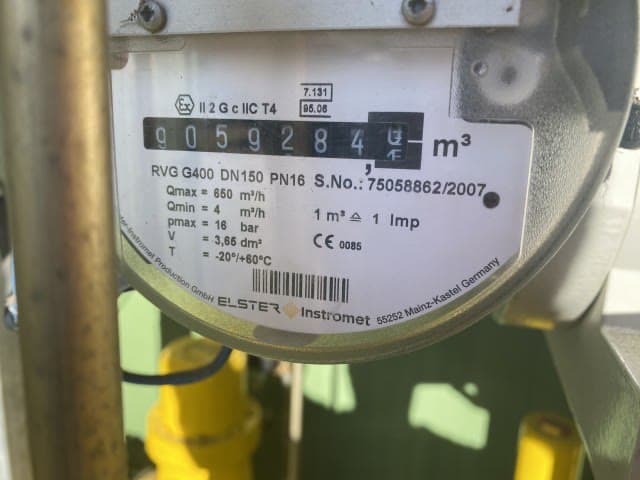
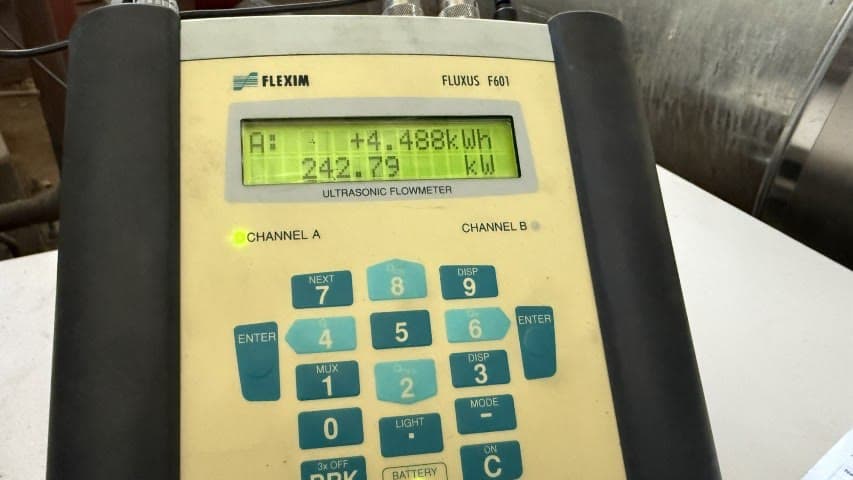
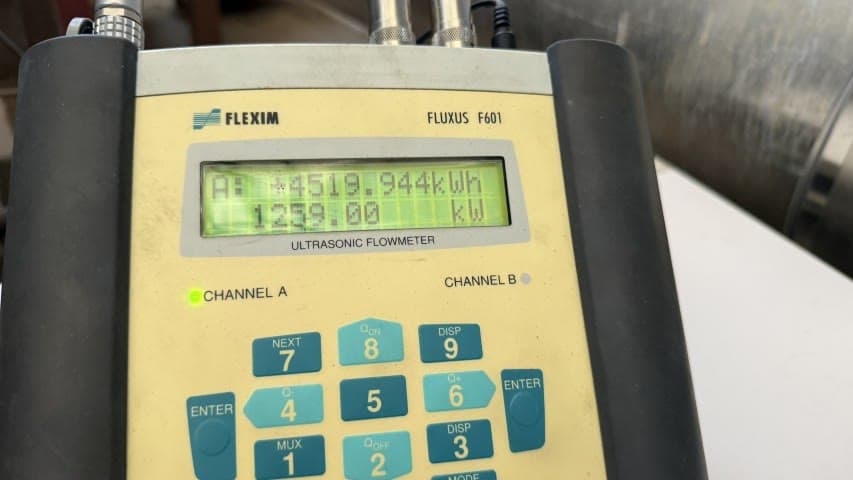
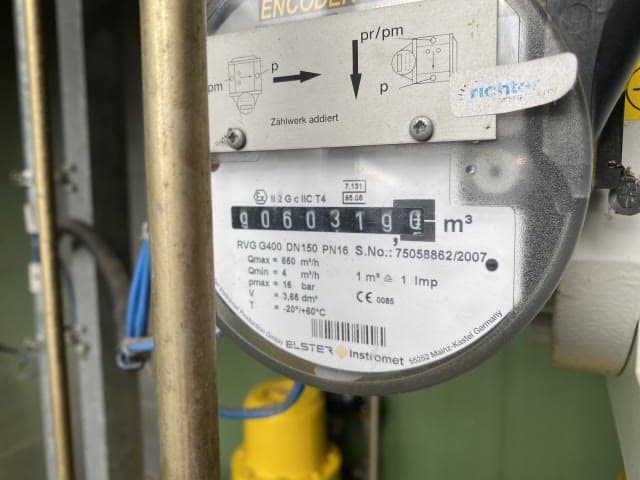
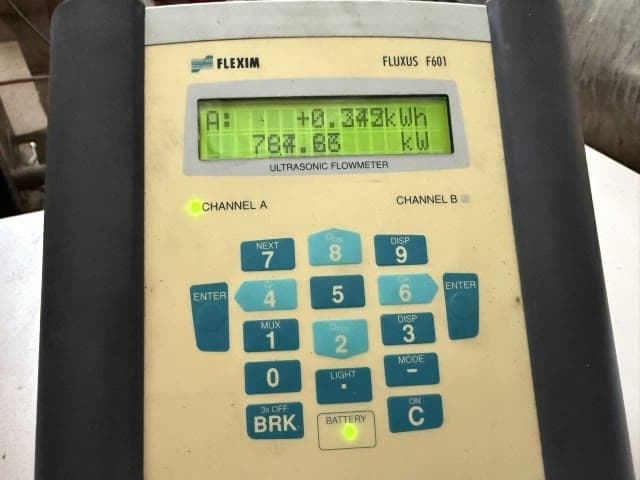
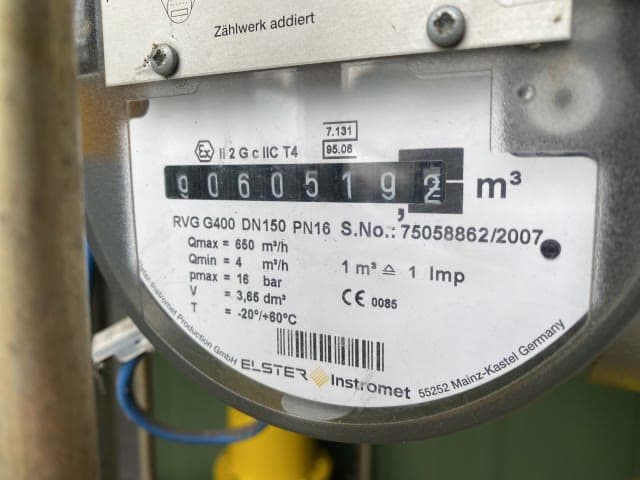
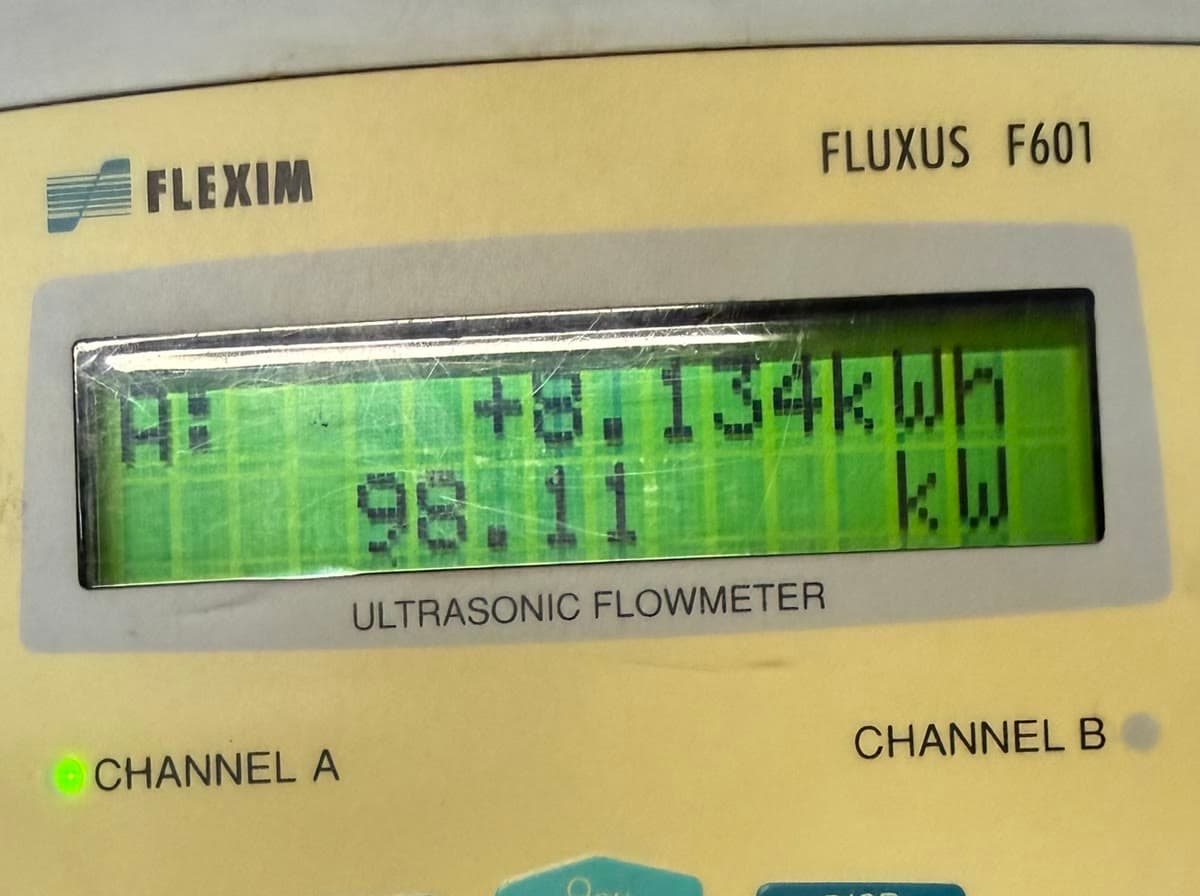
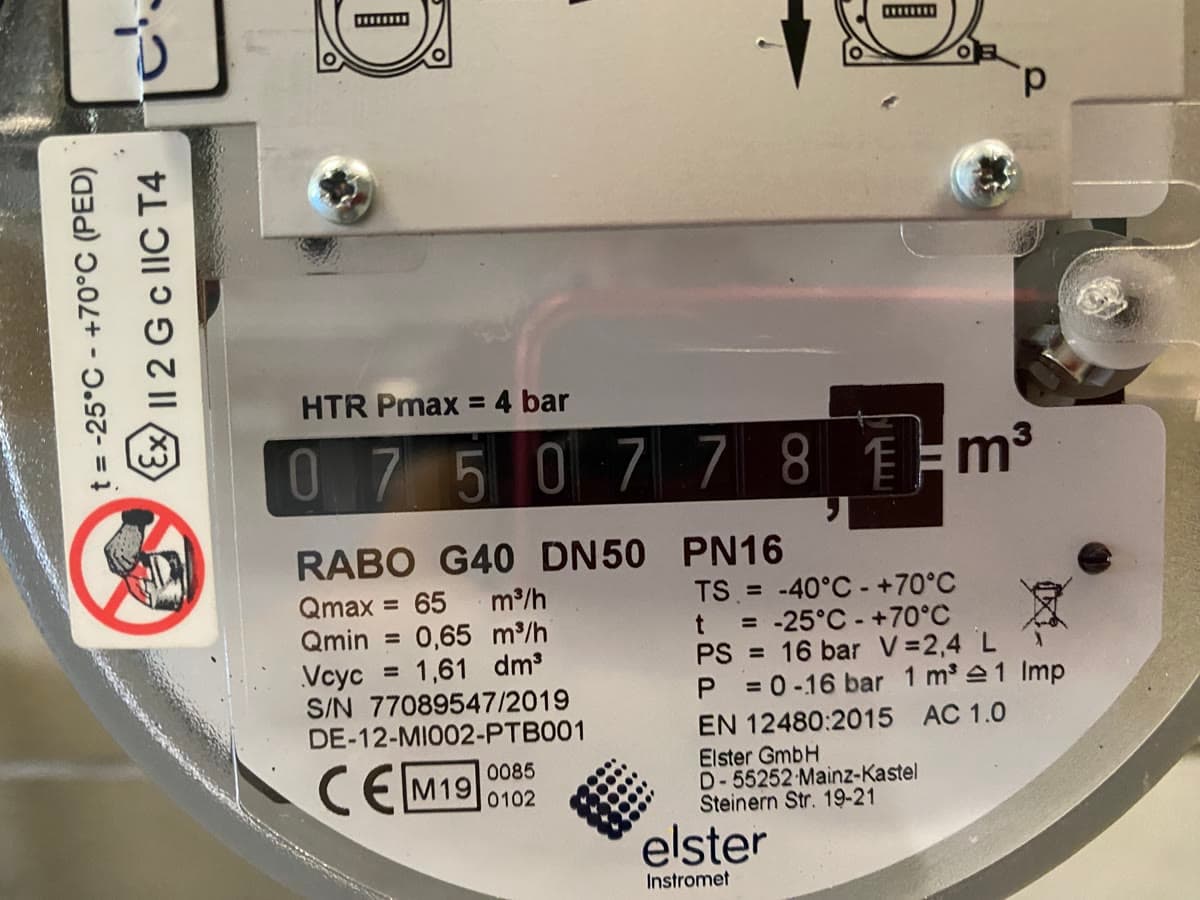
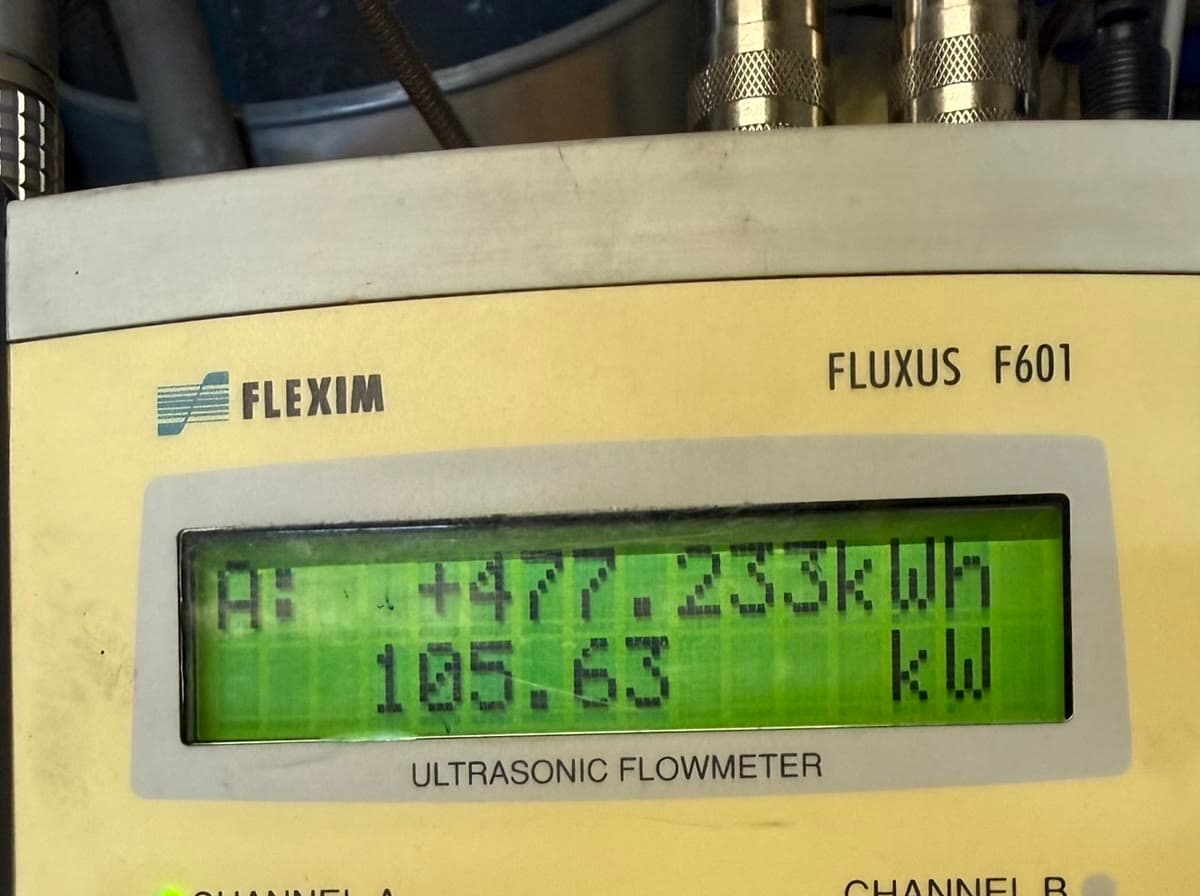
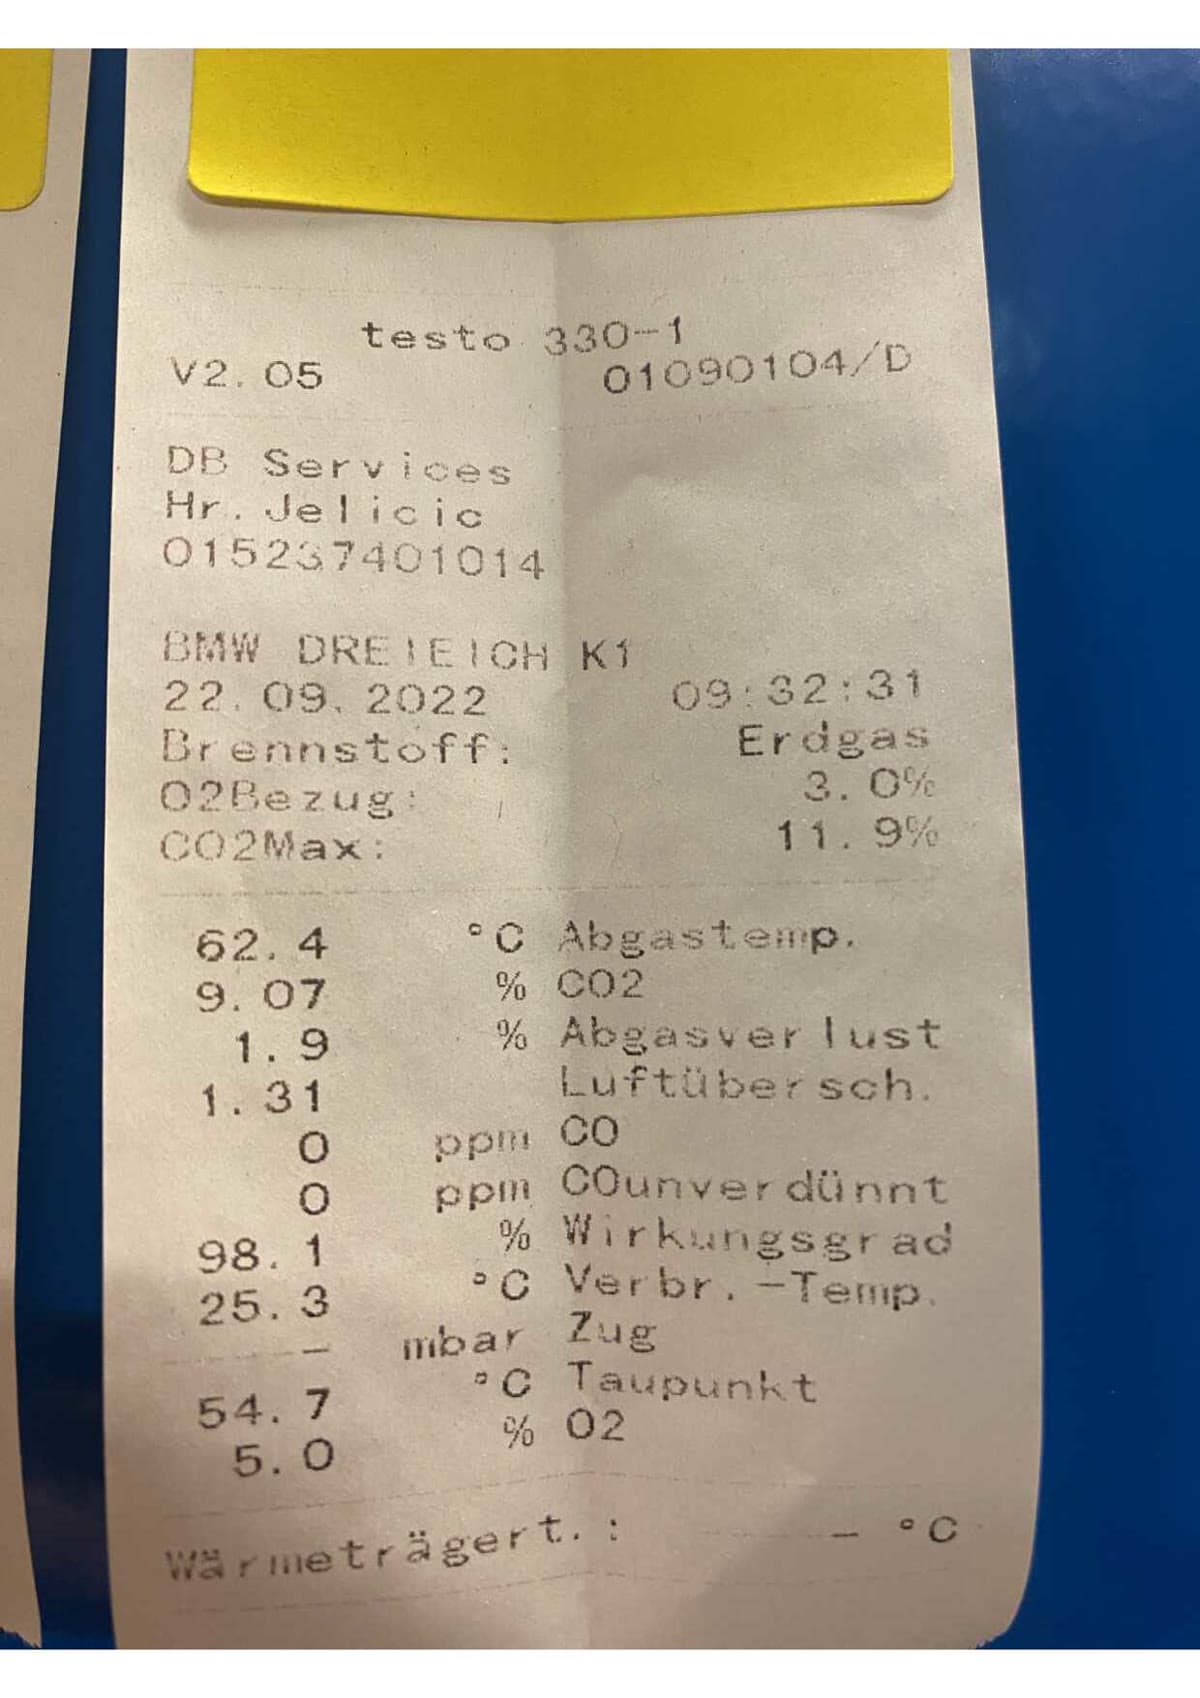
Every measurement run includes time-stamped proof photos of the meter readings — before and after, on the same instruments, at documented load. Any engineer can recalculate the values in the protocol. Two recent cases:
Case 1 — hospital (July 2026)
Two boilers built in 1991 · measurement runs on 30 June (without ceramics) and 1 July (with ceramics), identical time windows.
BEFORE installation — 30 June 2026
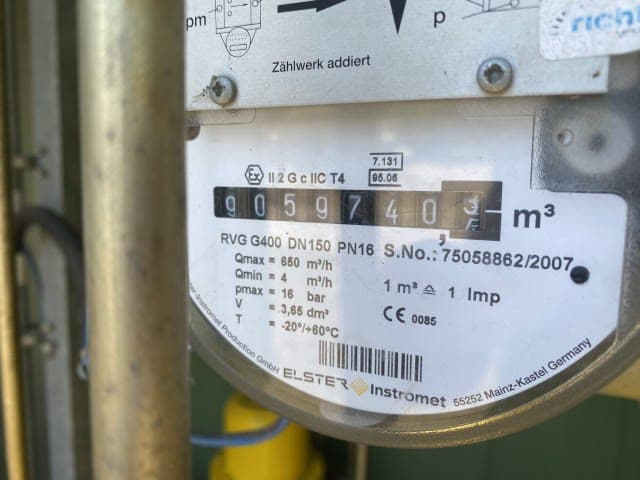
AFTER installation — 1 July 2026
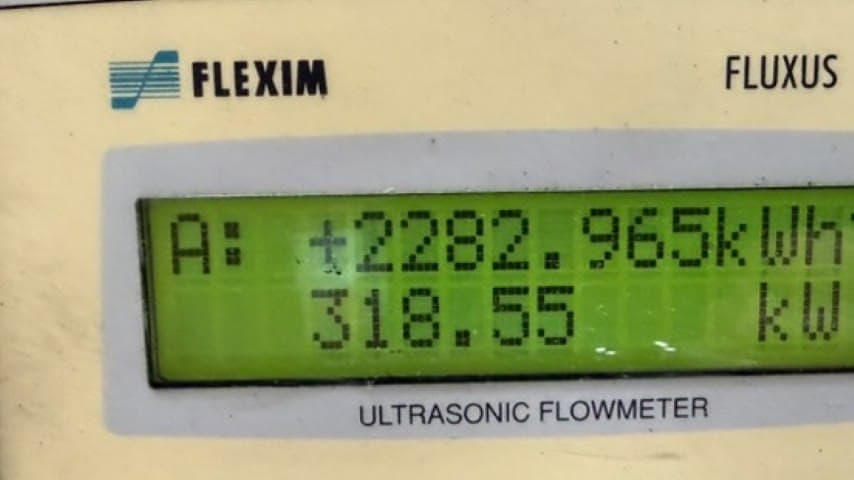
15.22 %
measured efficiency gain — 12 % was forecast
0.54 years
payback
€118,890
saved per year
Case 2 — automotive branch (April 2026)
Including a condensing boiler already at ~99 % efficiency — even there the 10 % forecast was almost doubled. Measurement runs of 240 minutes each, supervised by our CTO.
Measurement start — 08:15
Measurement end — 12:15
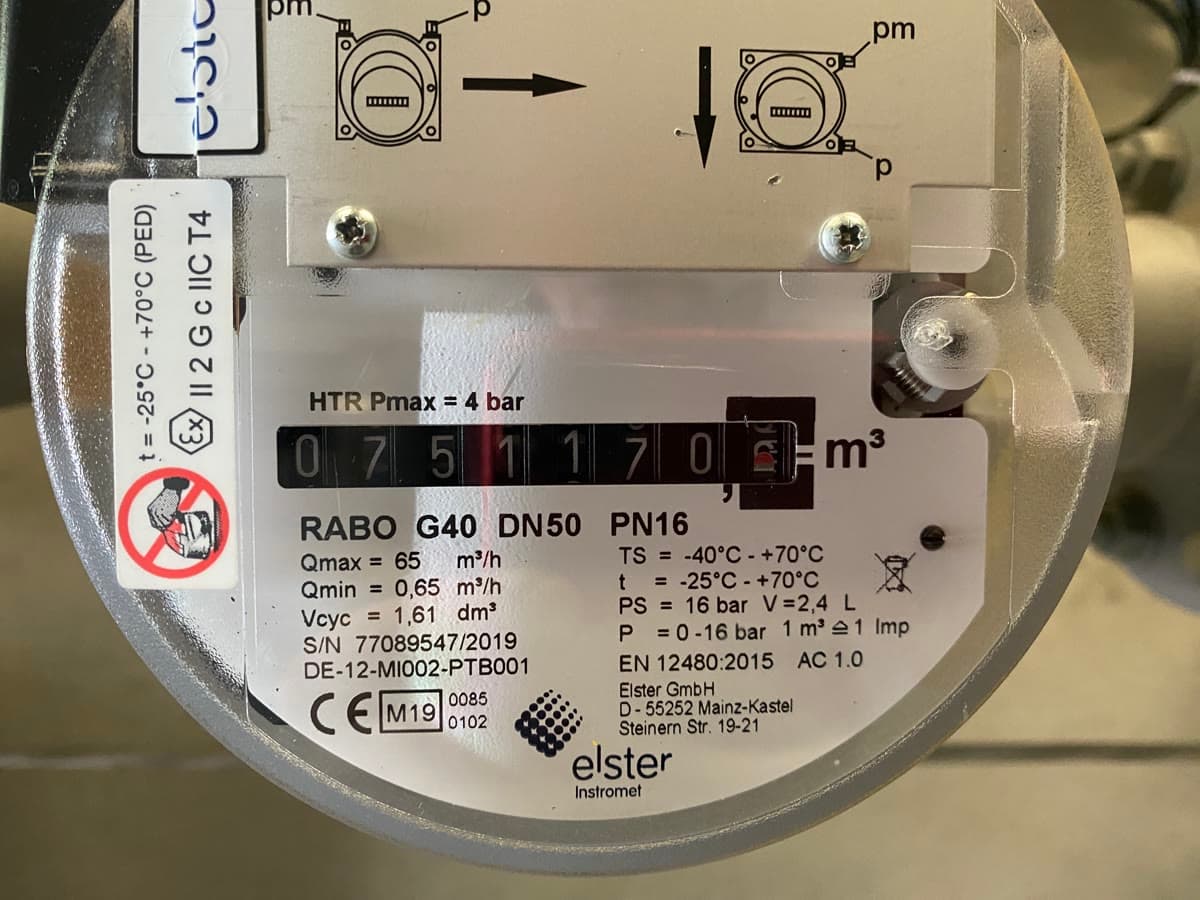
19.69 %
measured efficiency gain — 10 % was forecast
1.23 years
payback
€19,872
saved per year
We have done this many times
From ten years of installation records.
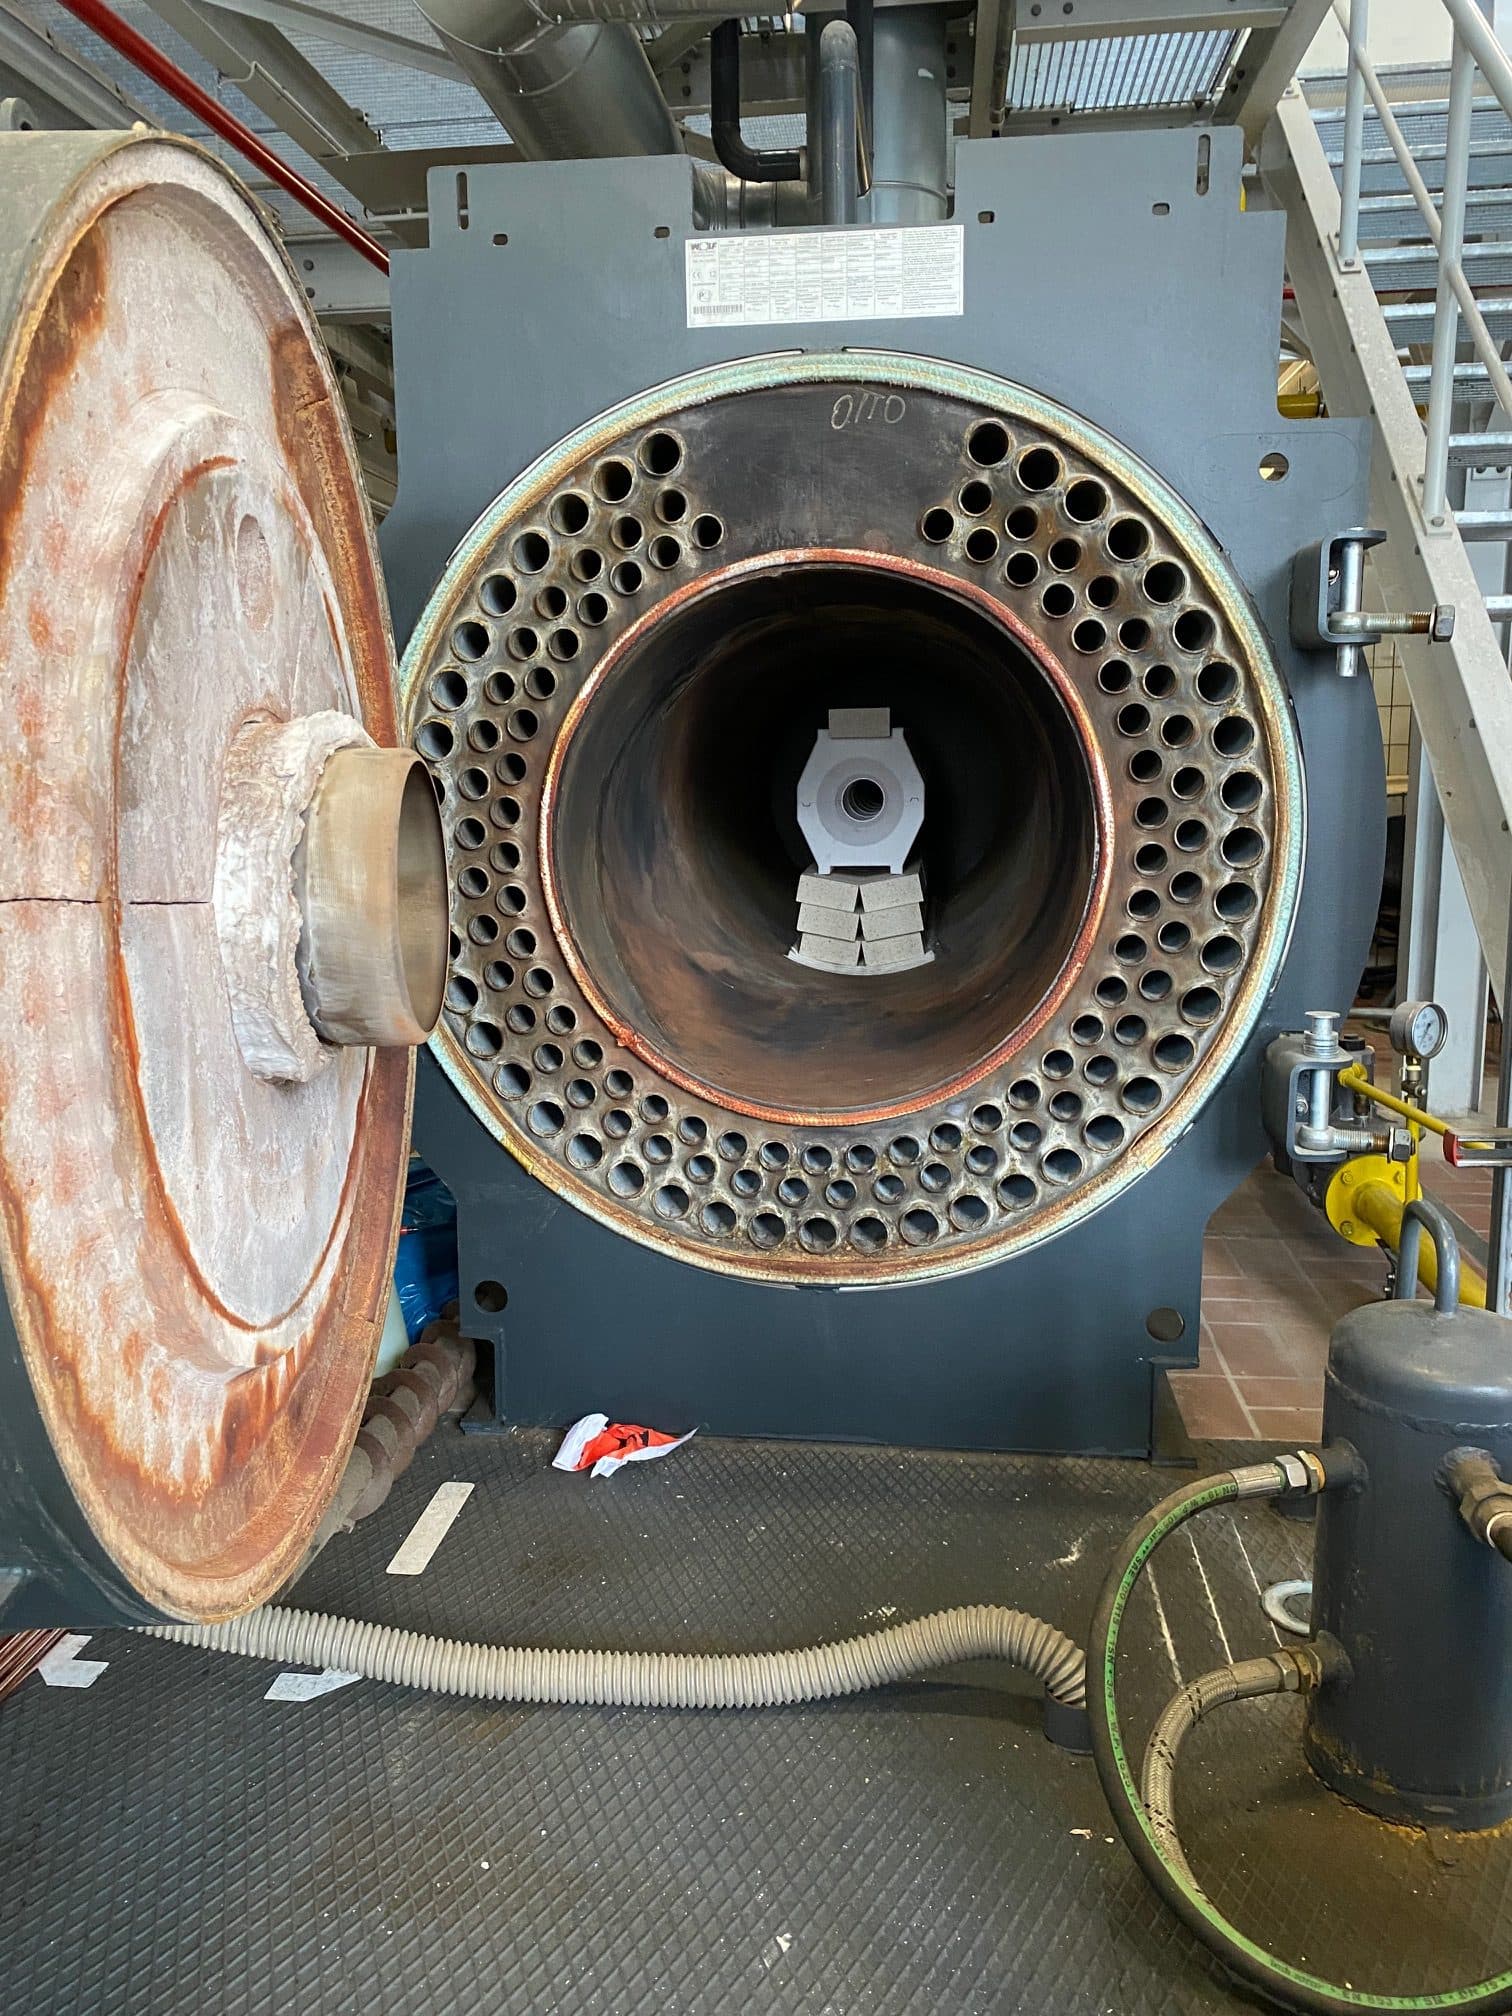
Different plants, different sizes, different industries — the same principle. From three-pass boilers to large plants, installed in one day during a maintenance window.
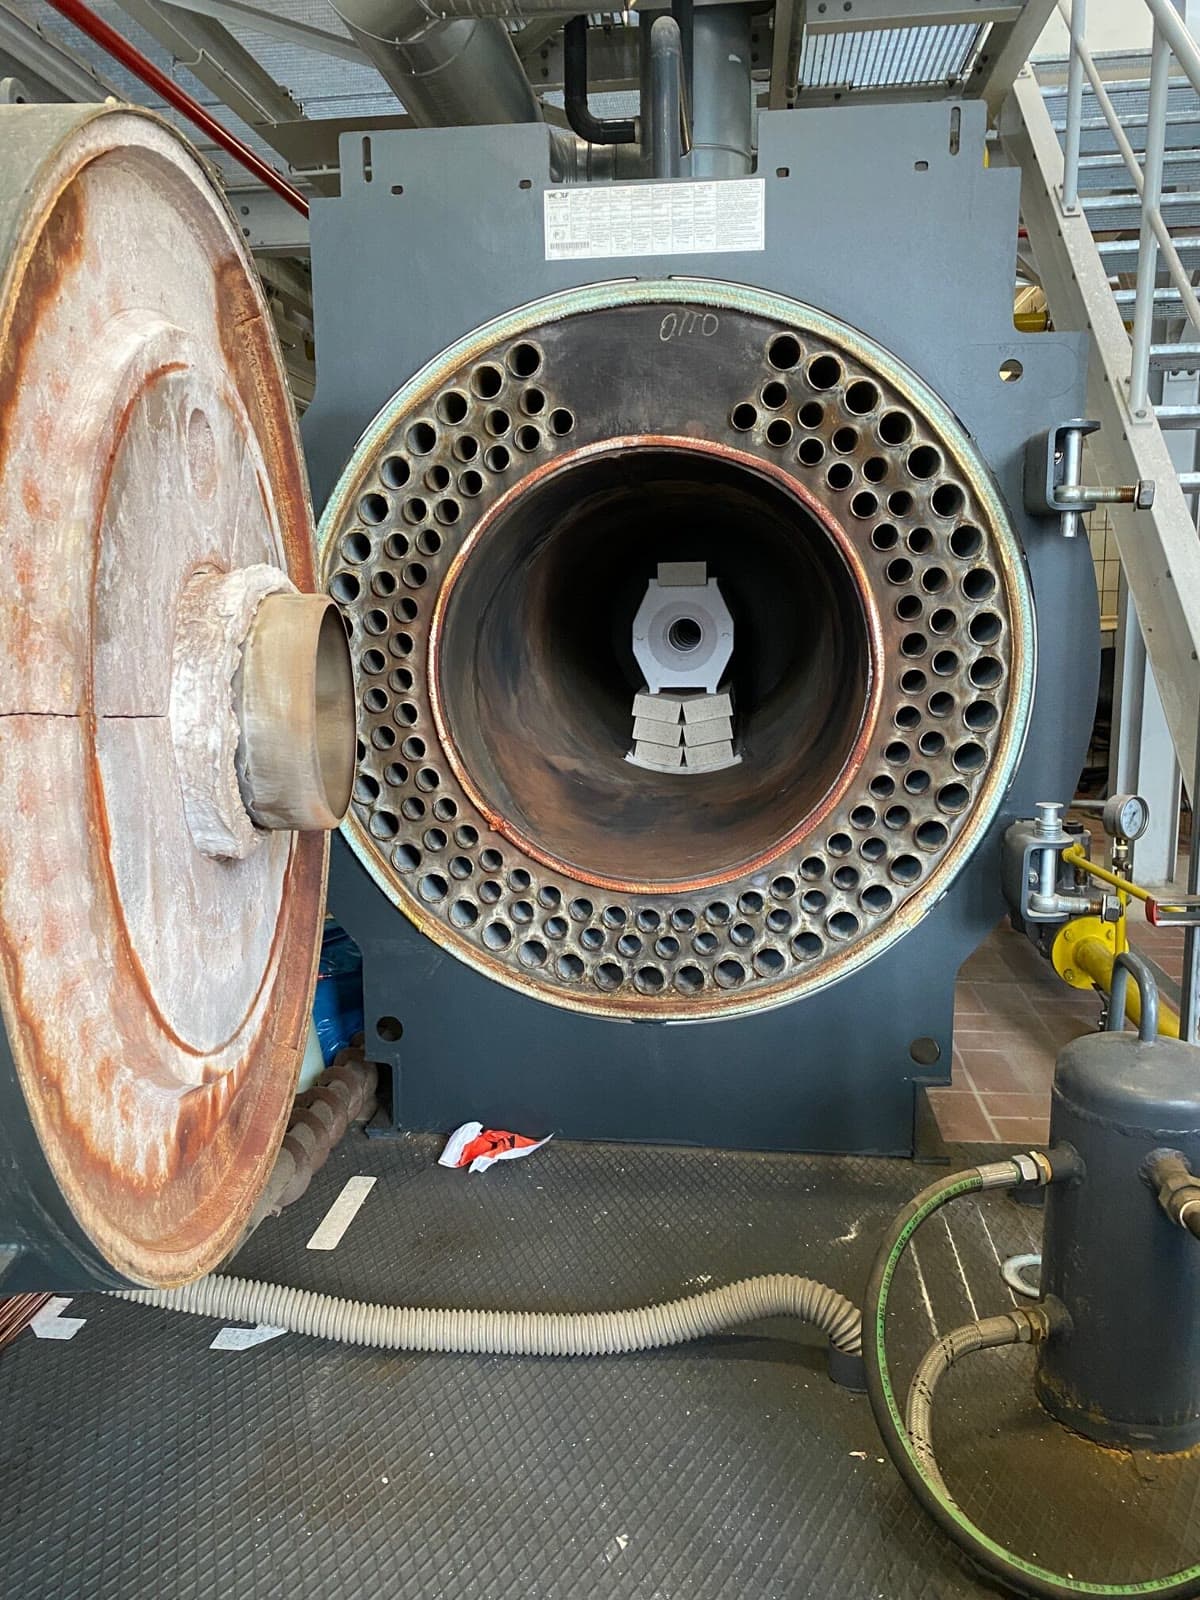
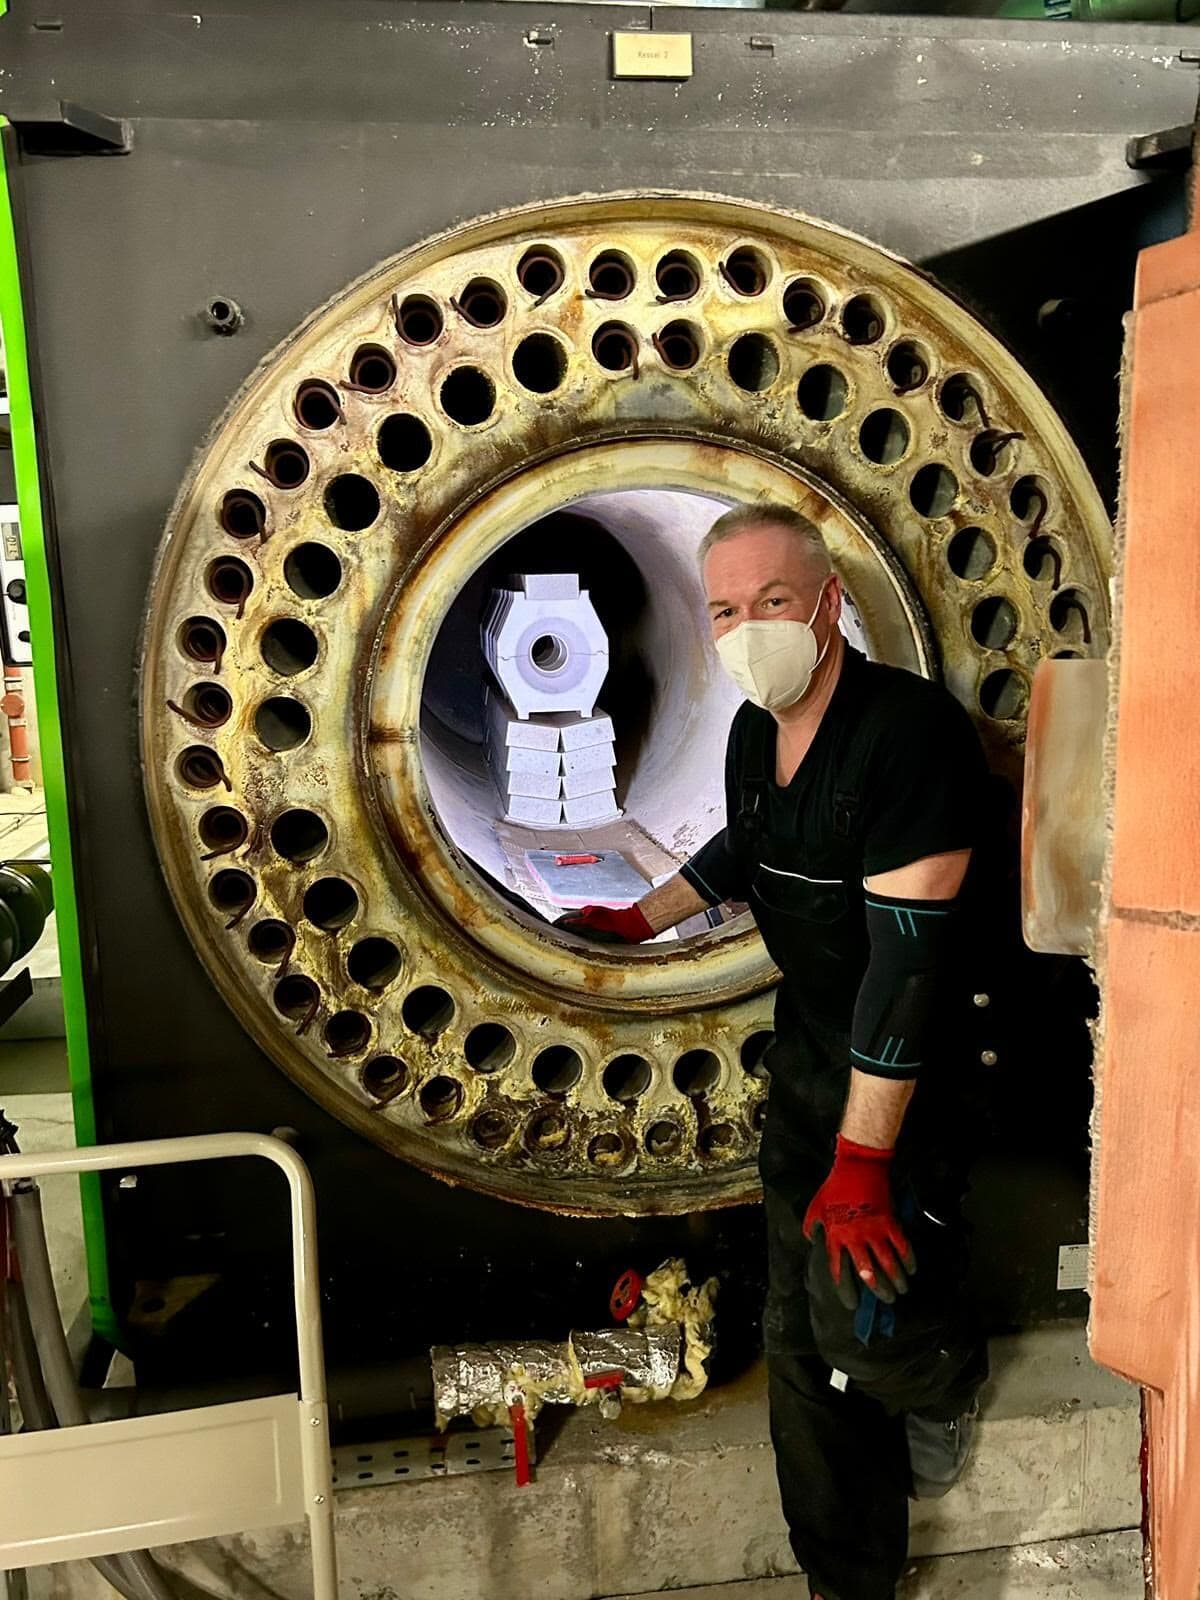
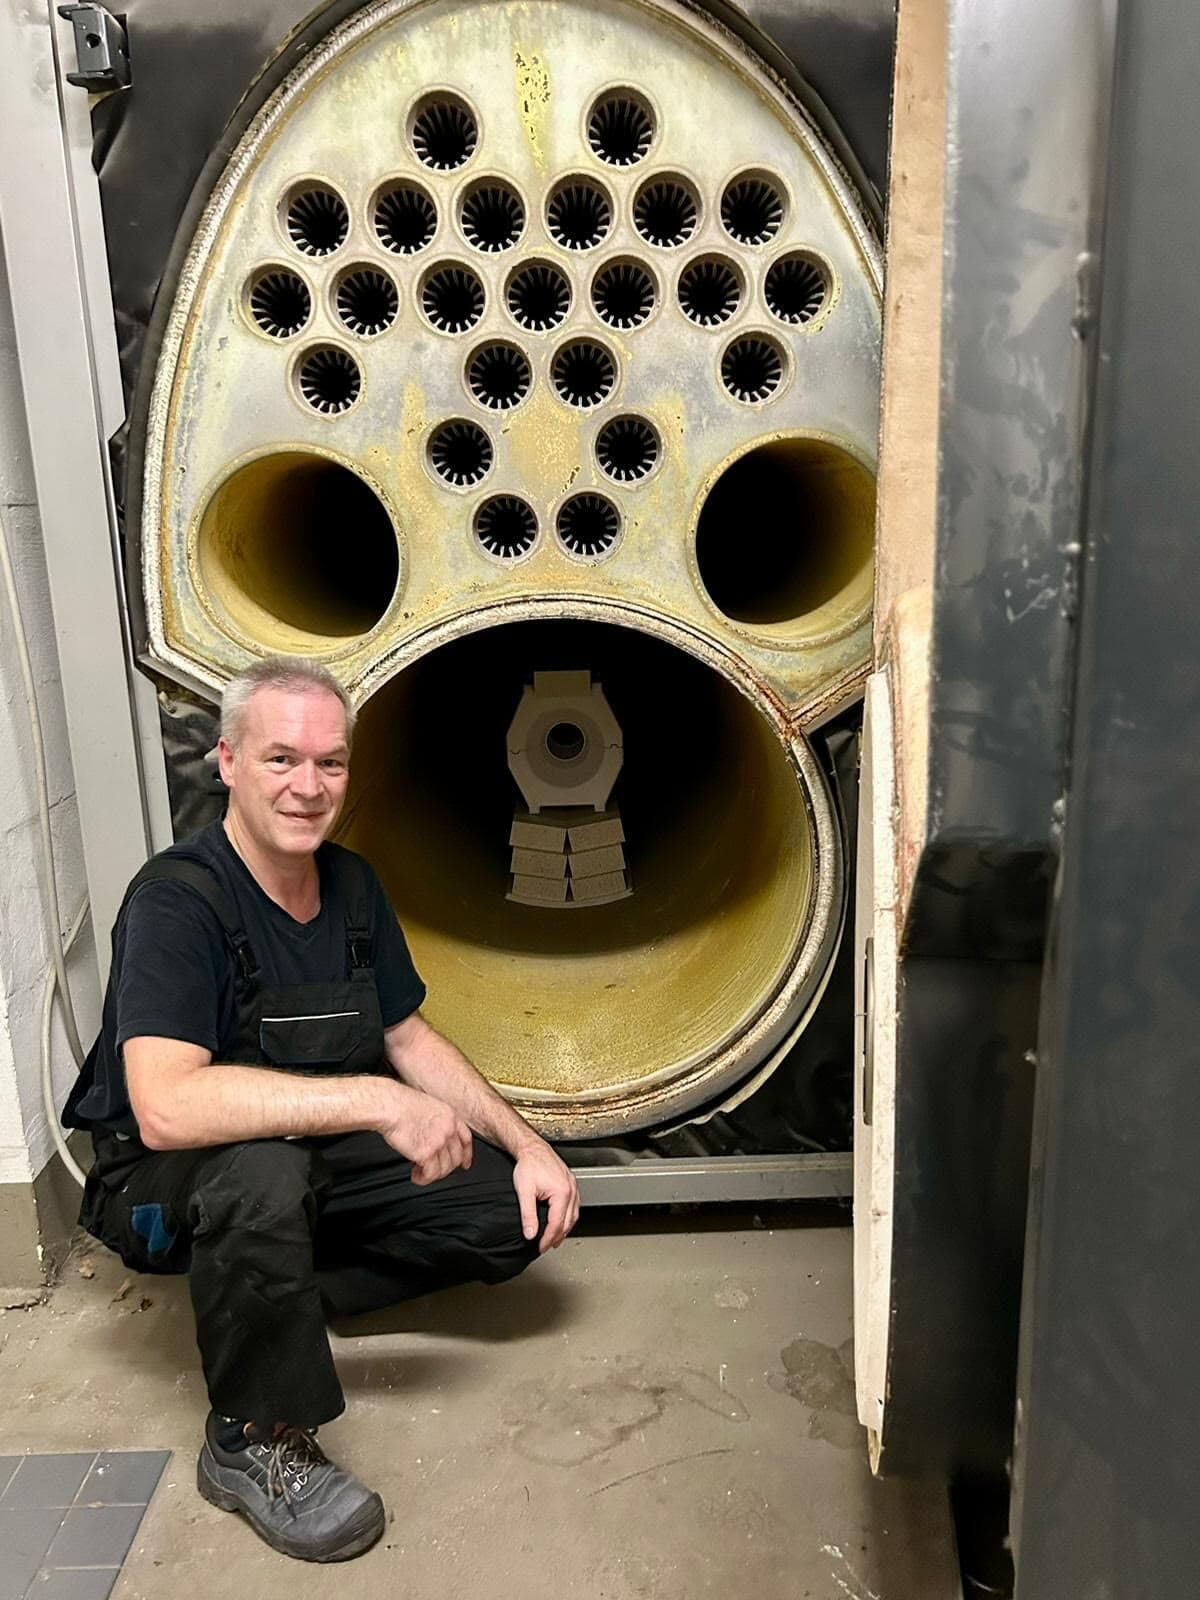
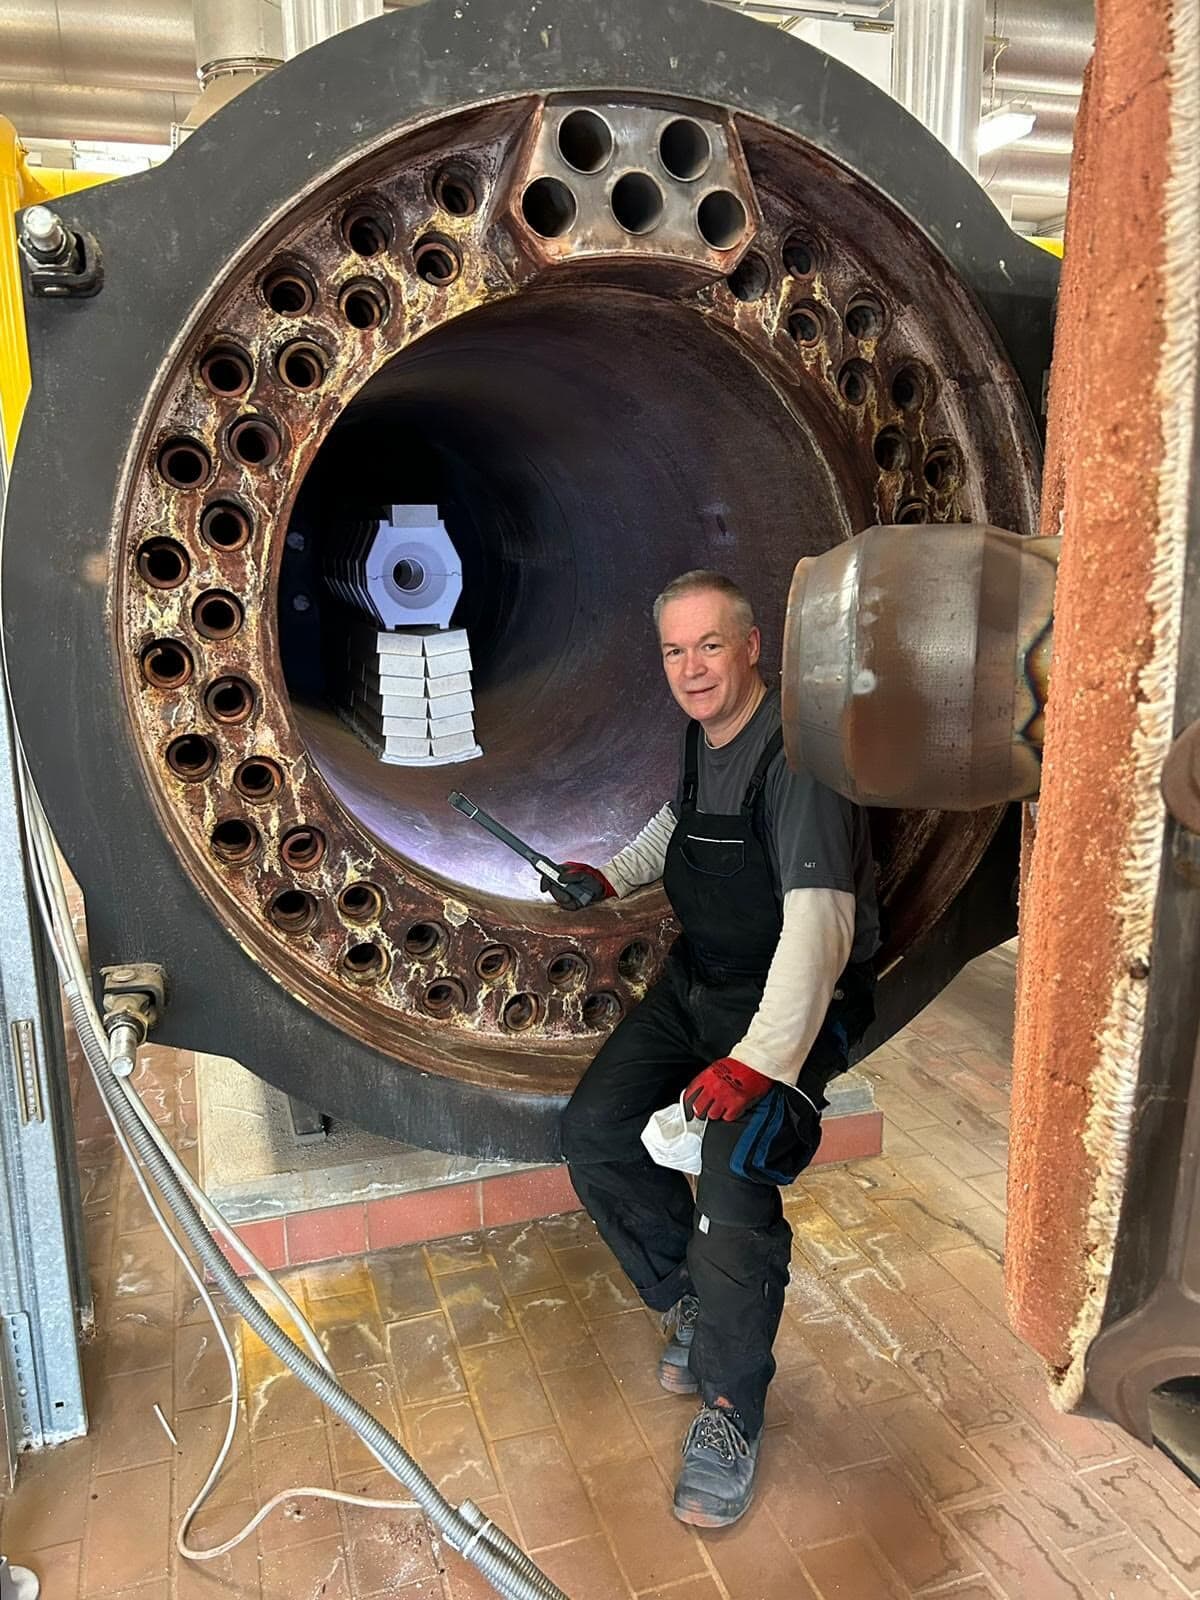
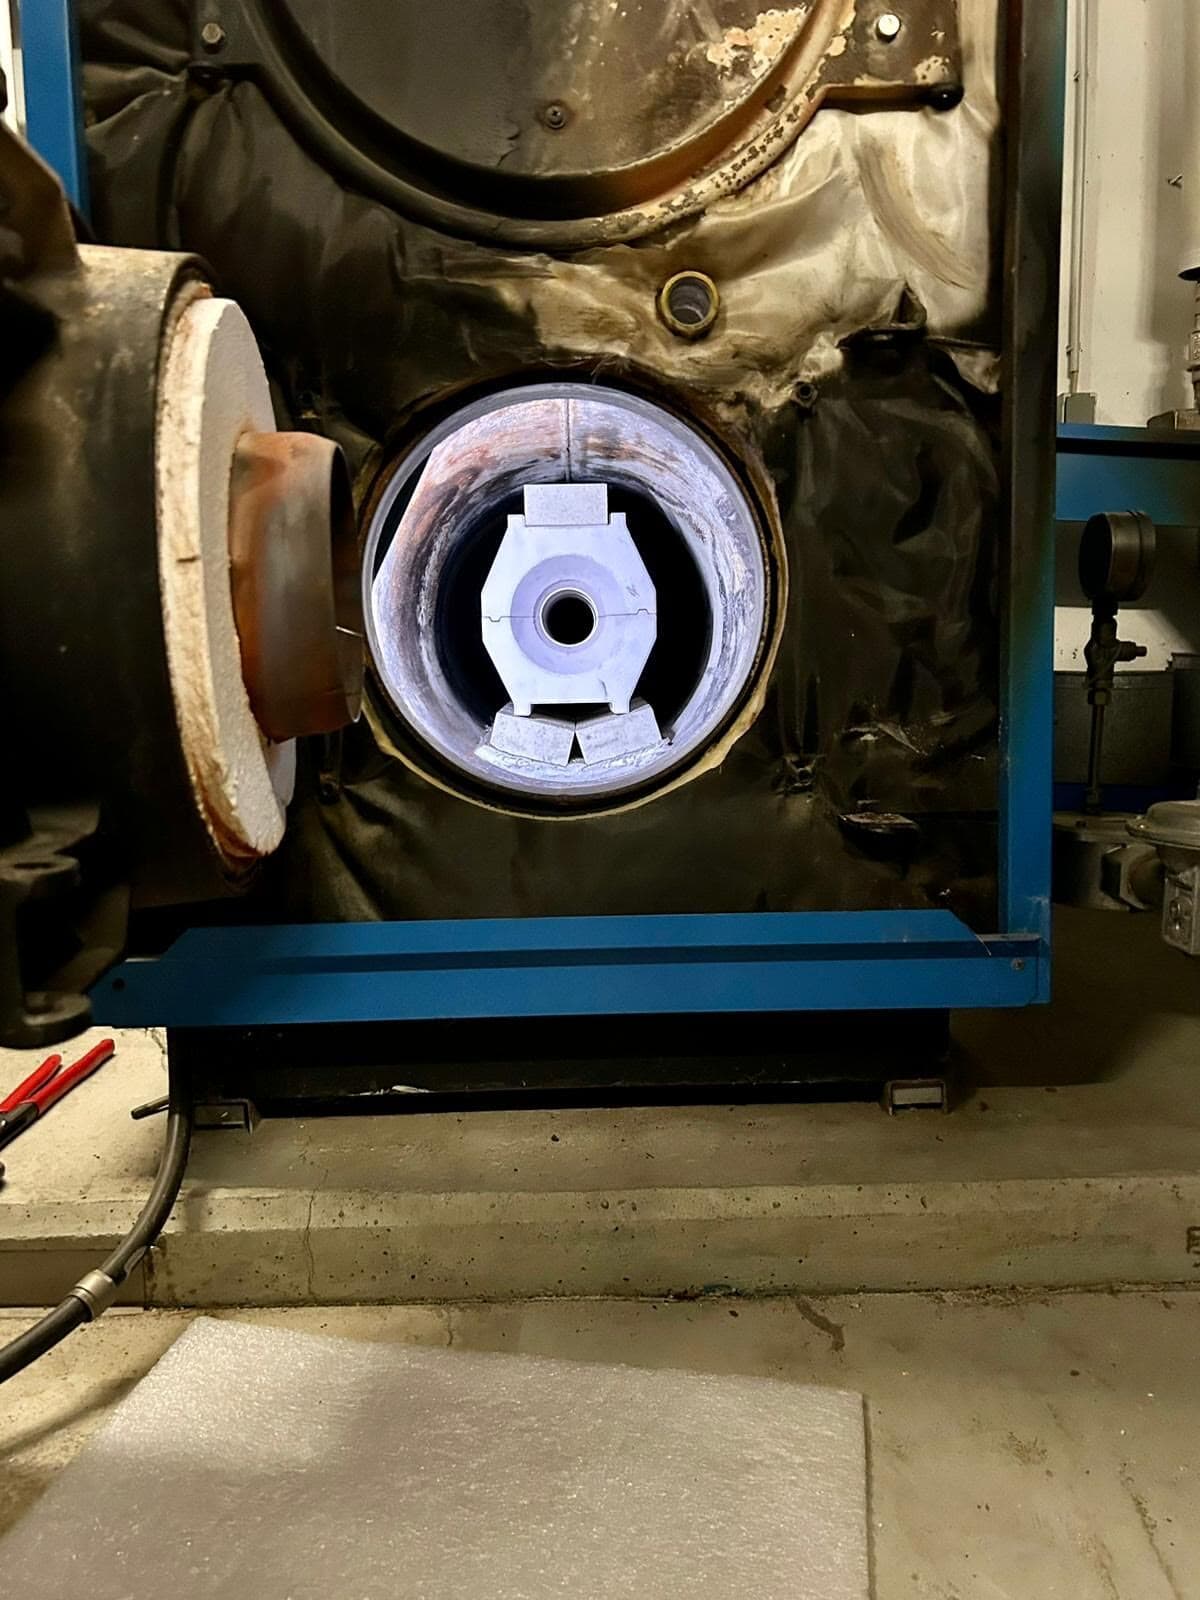
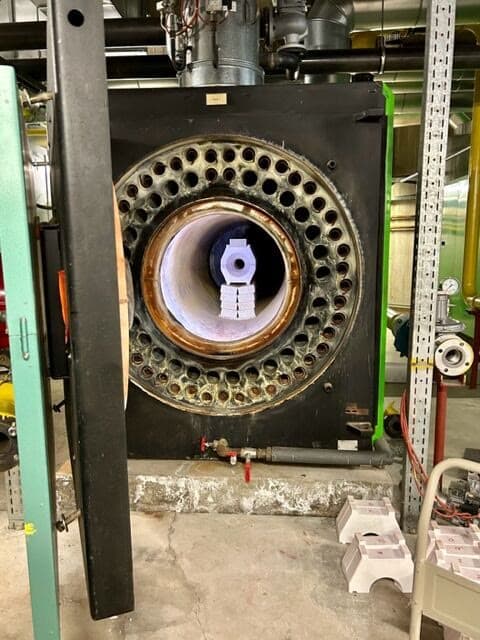
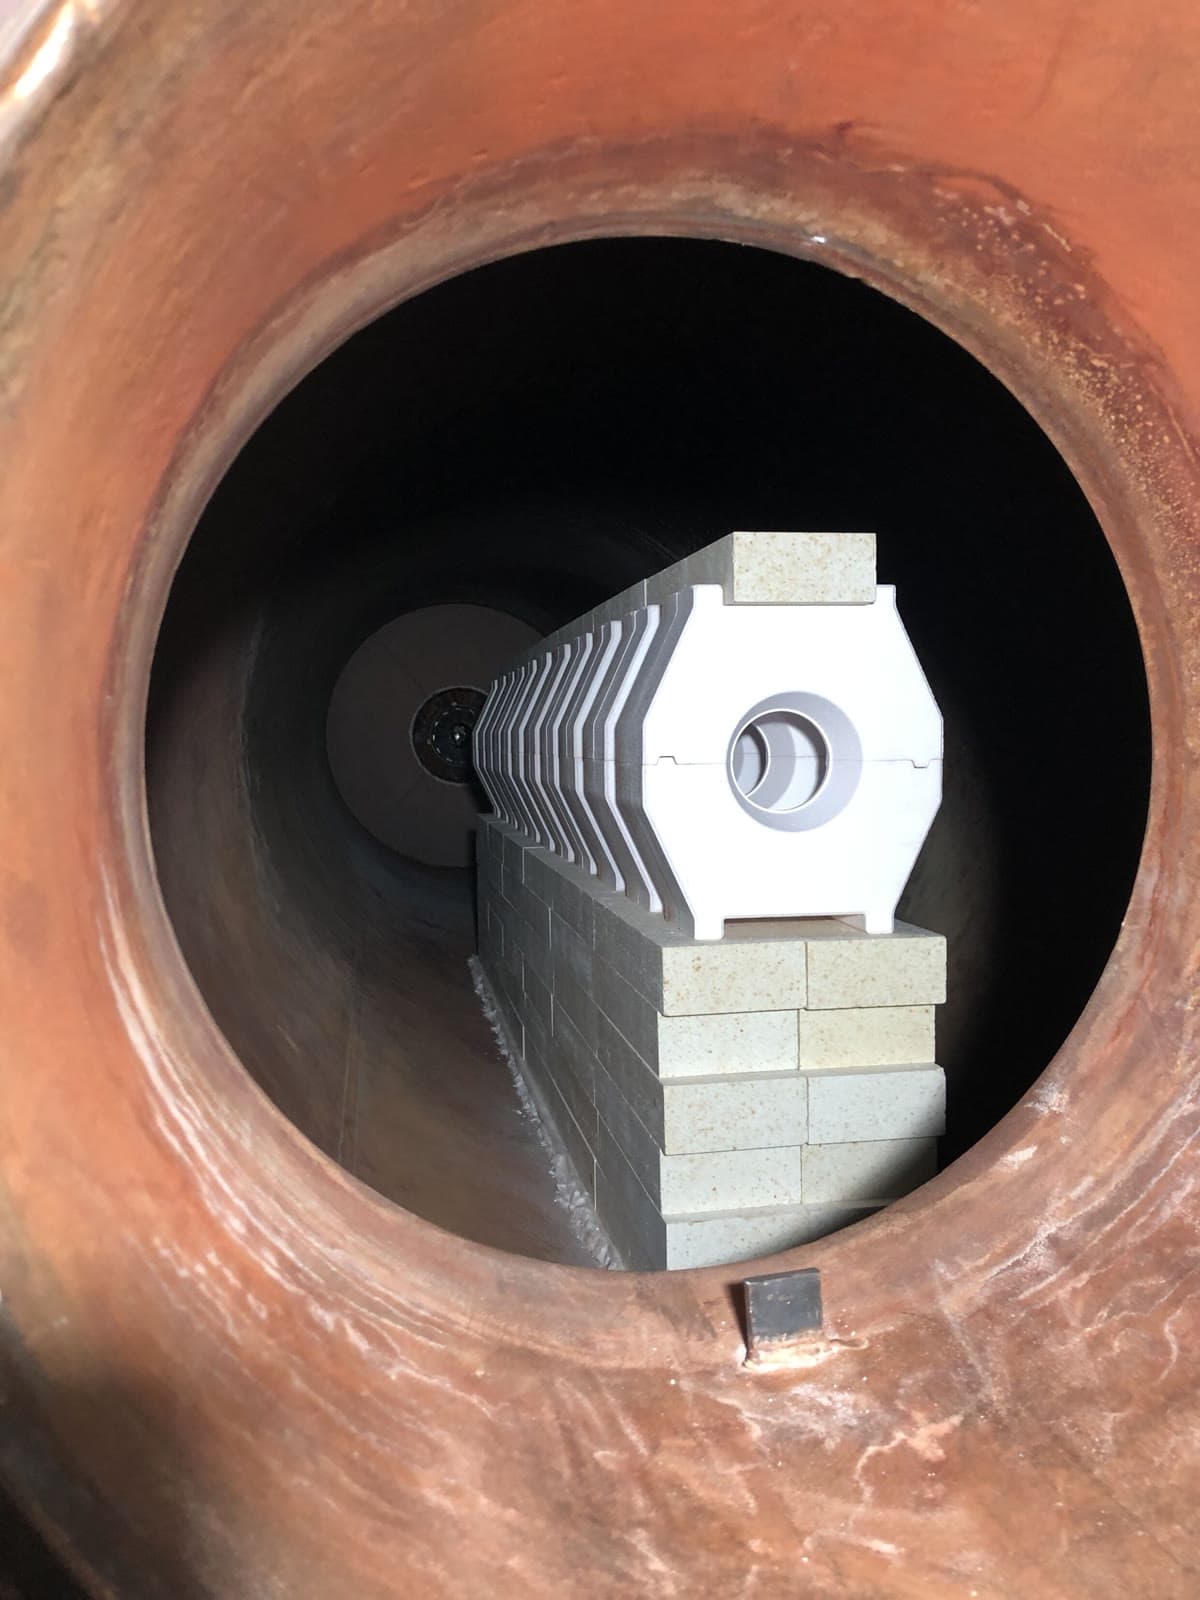
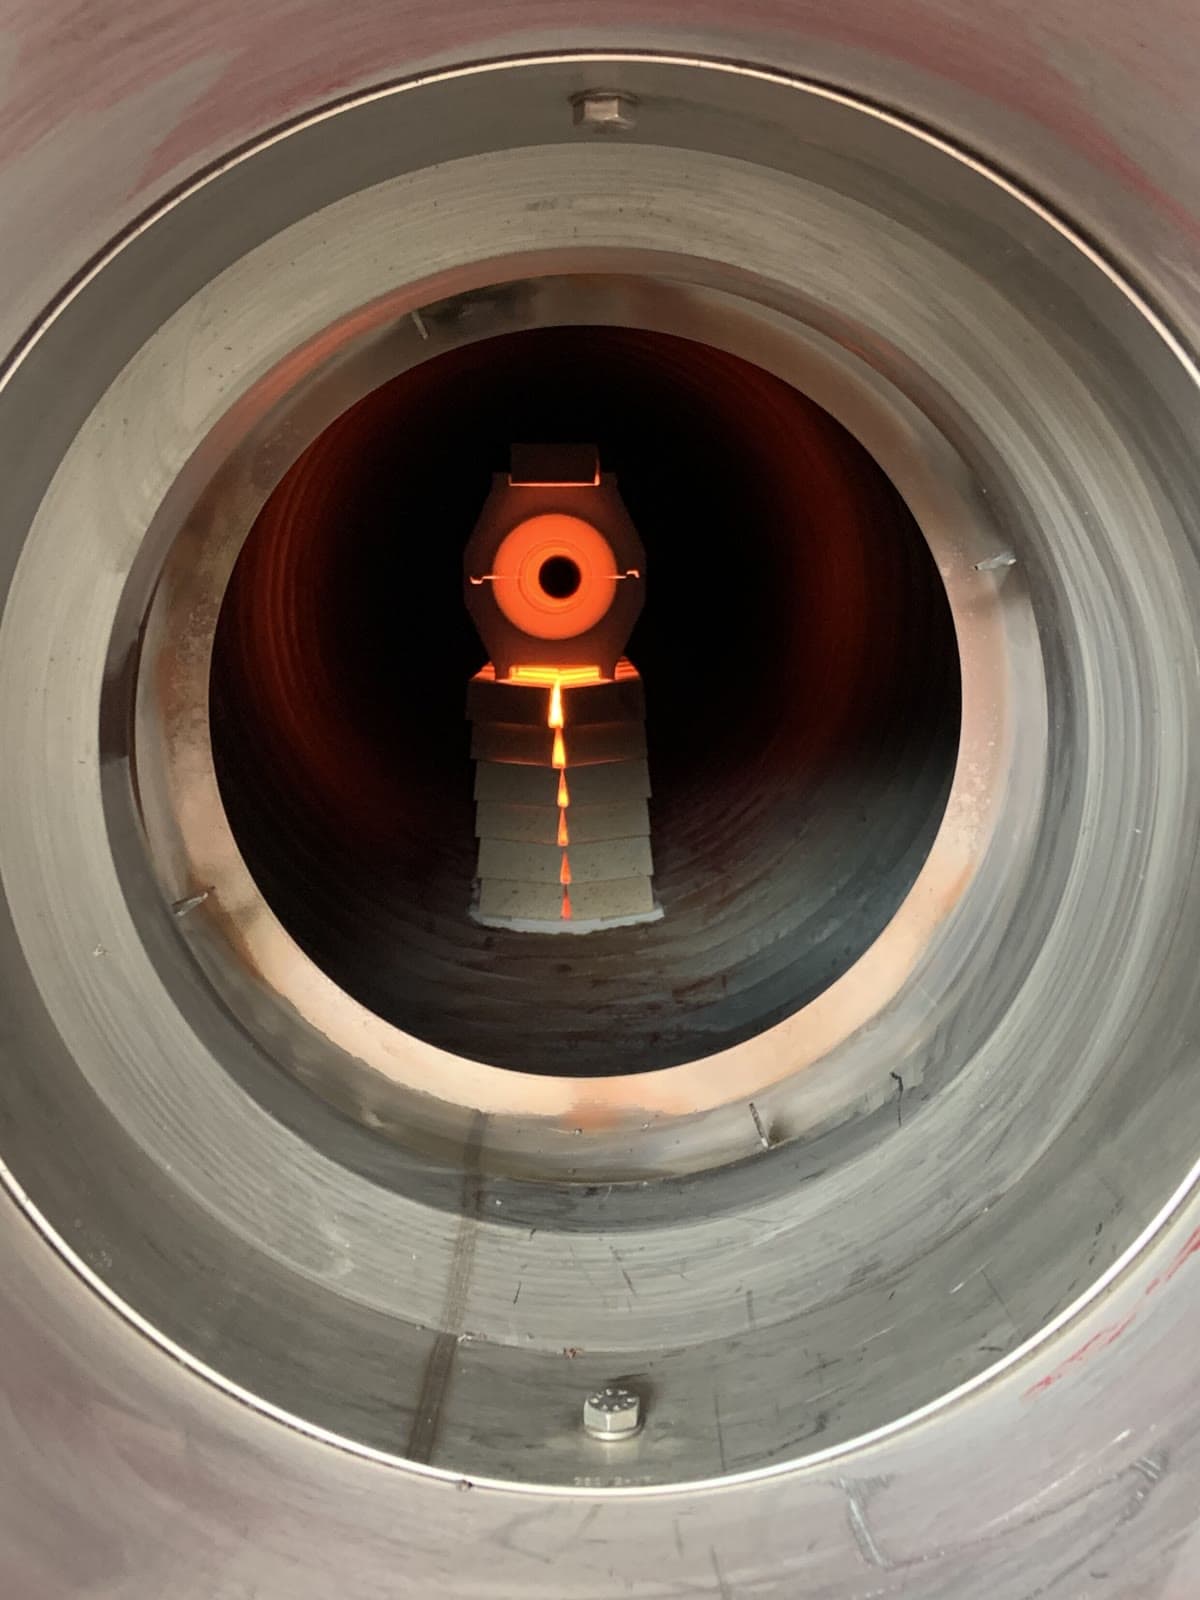
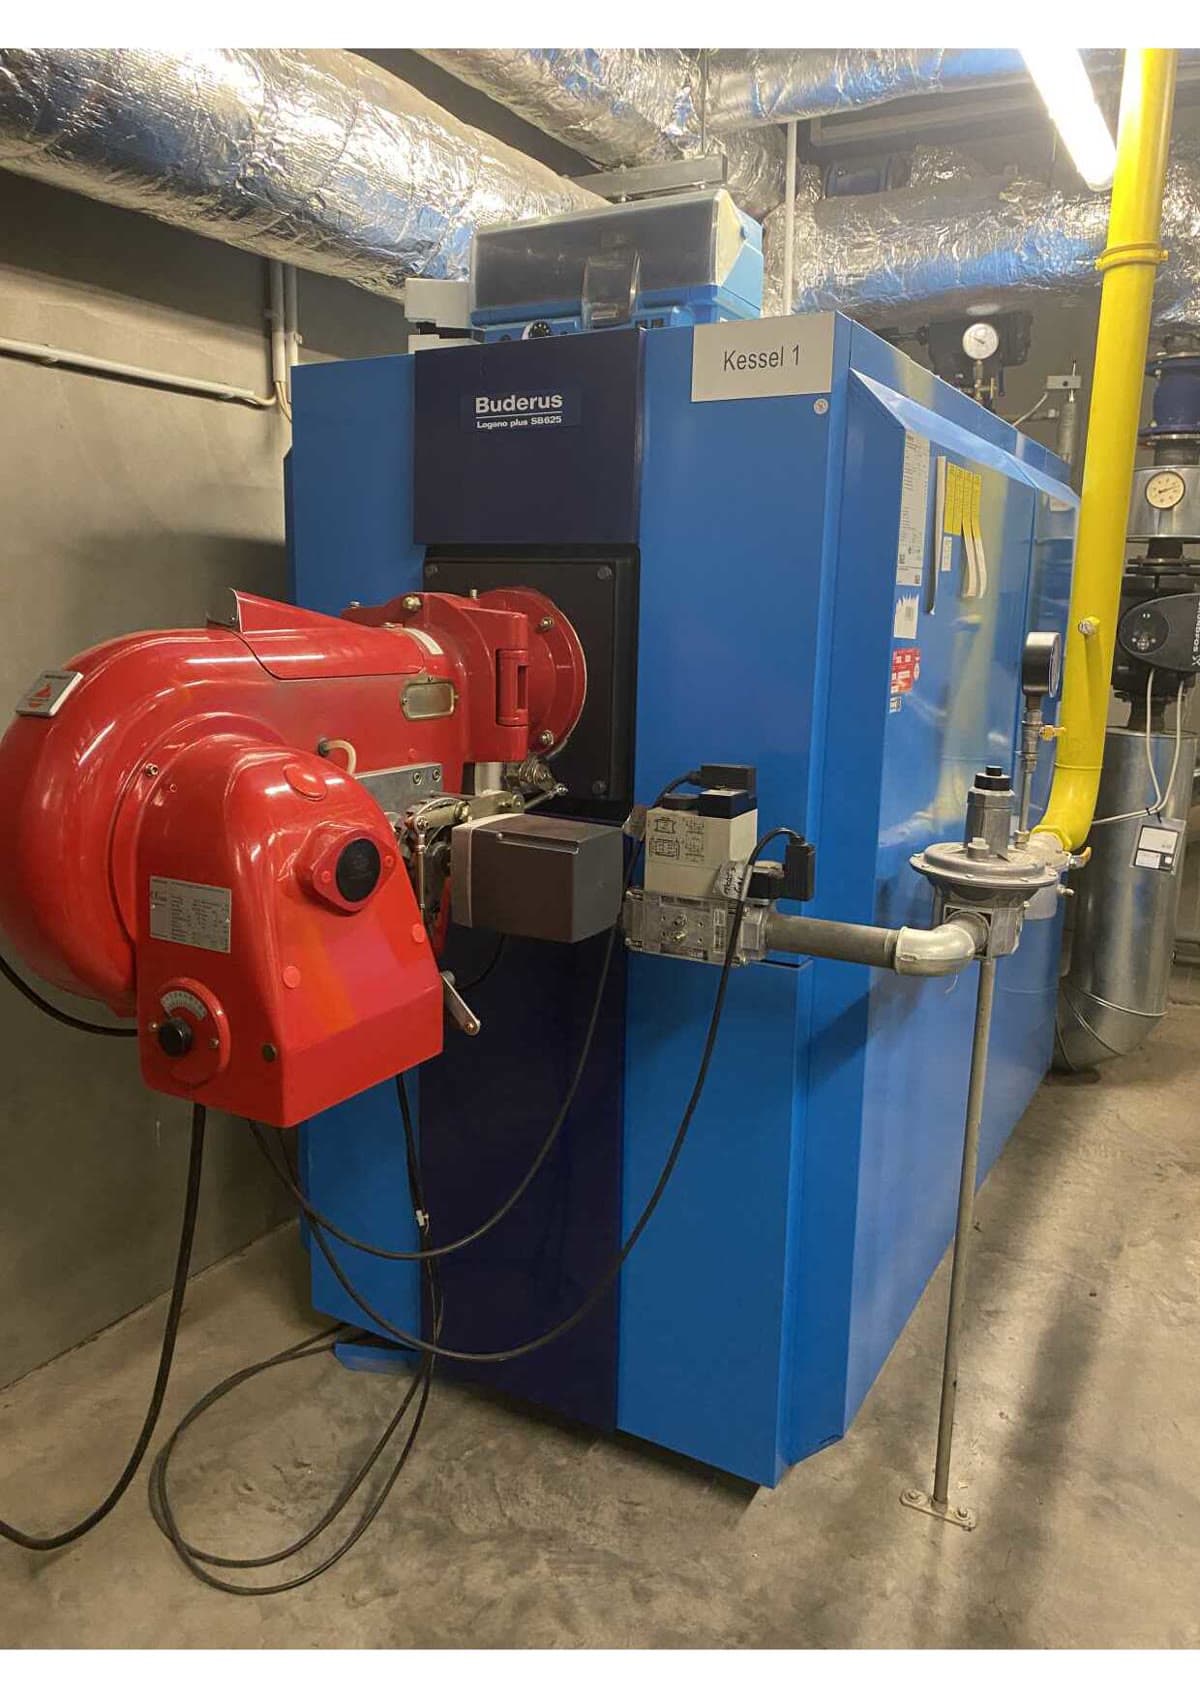
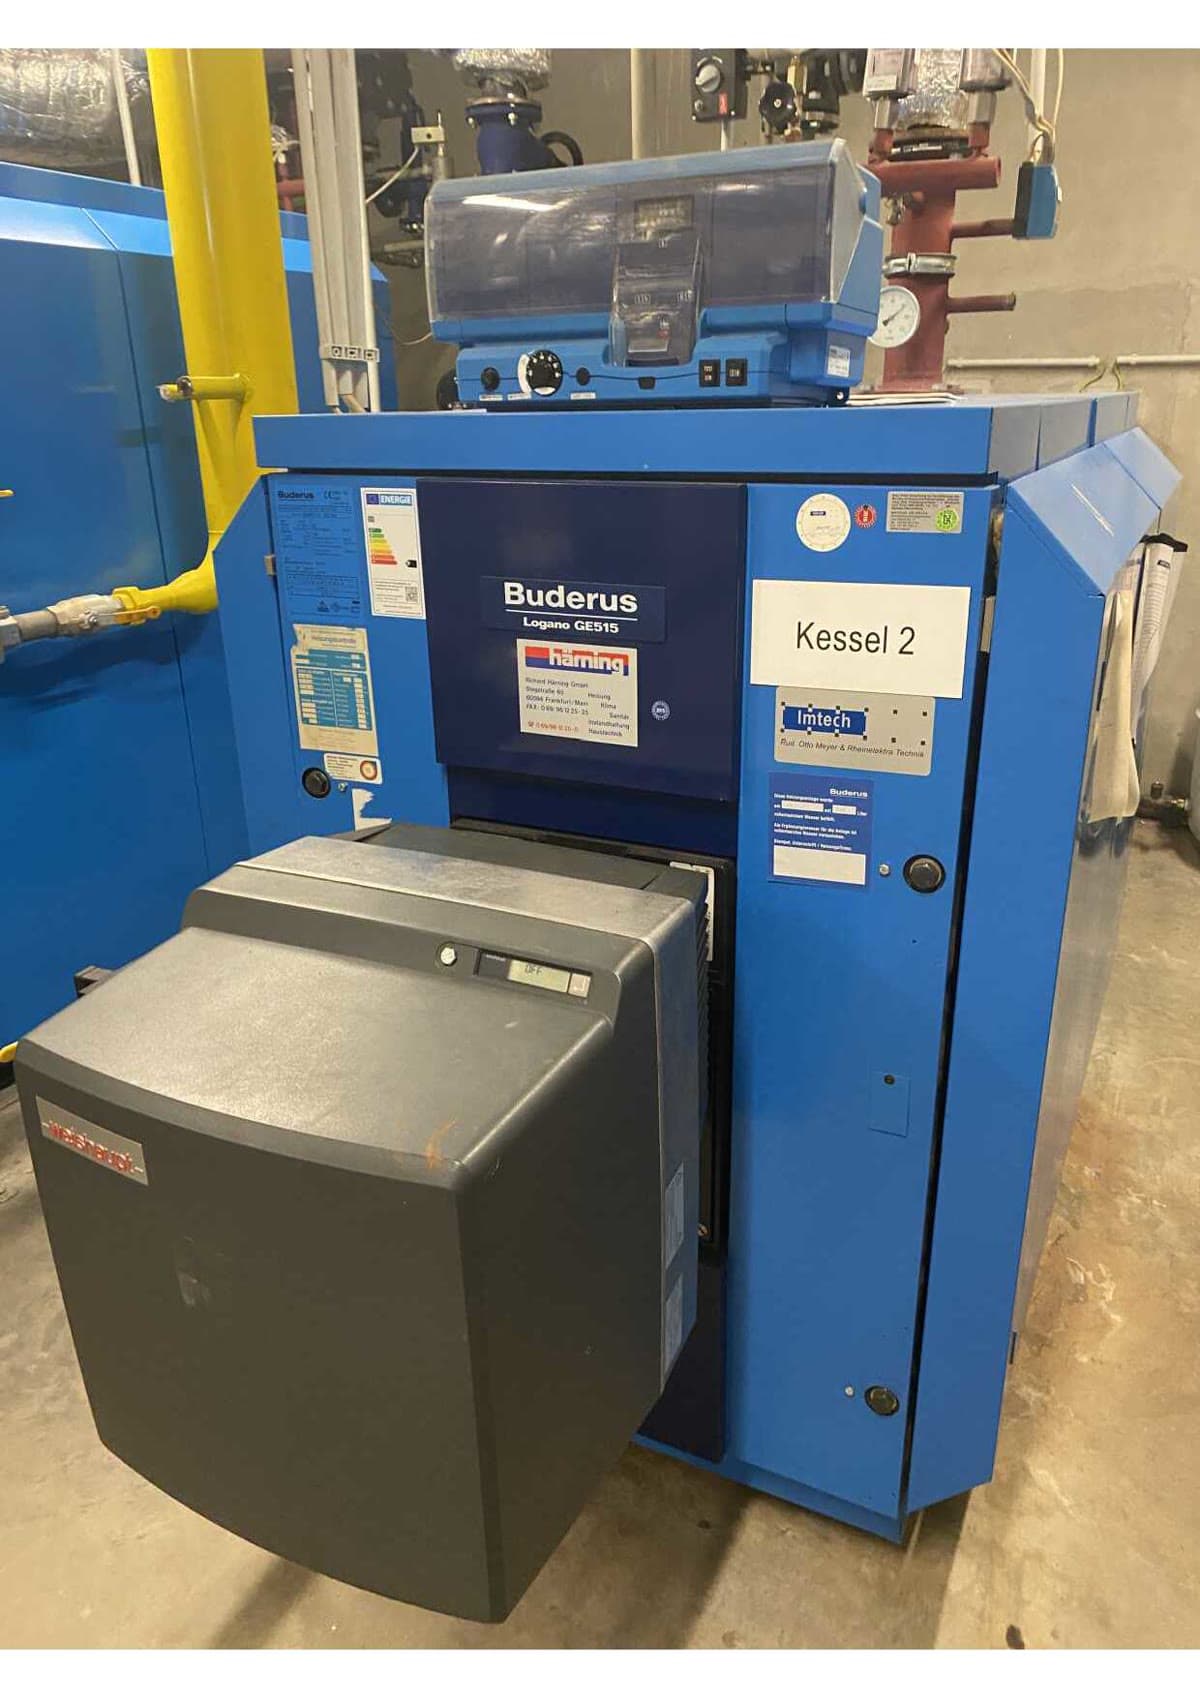
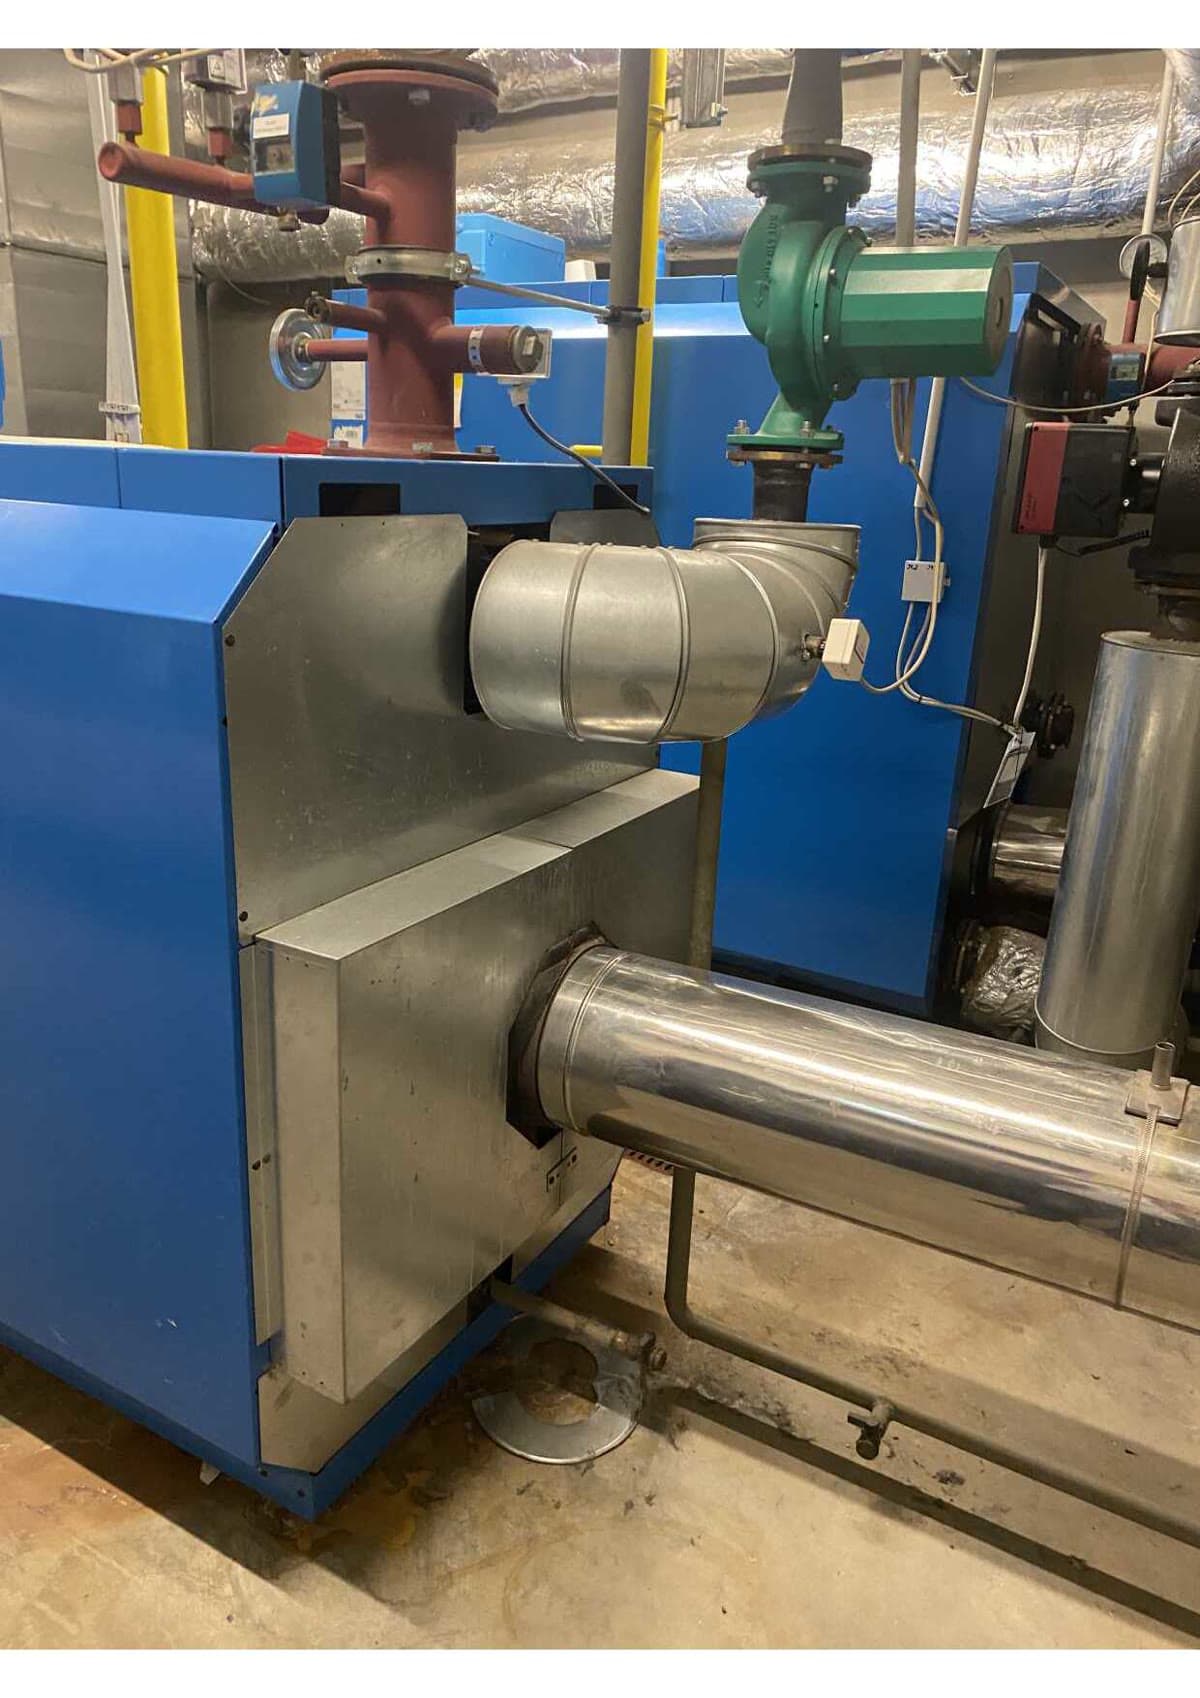
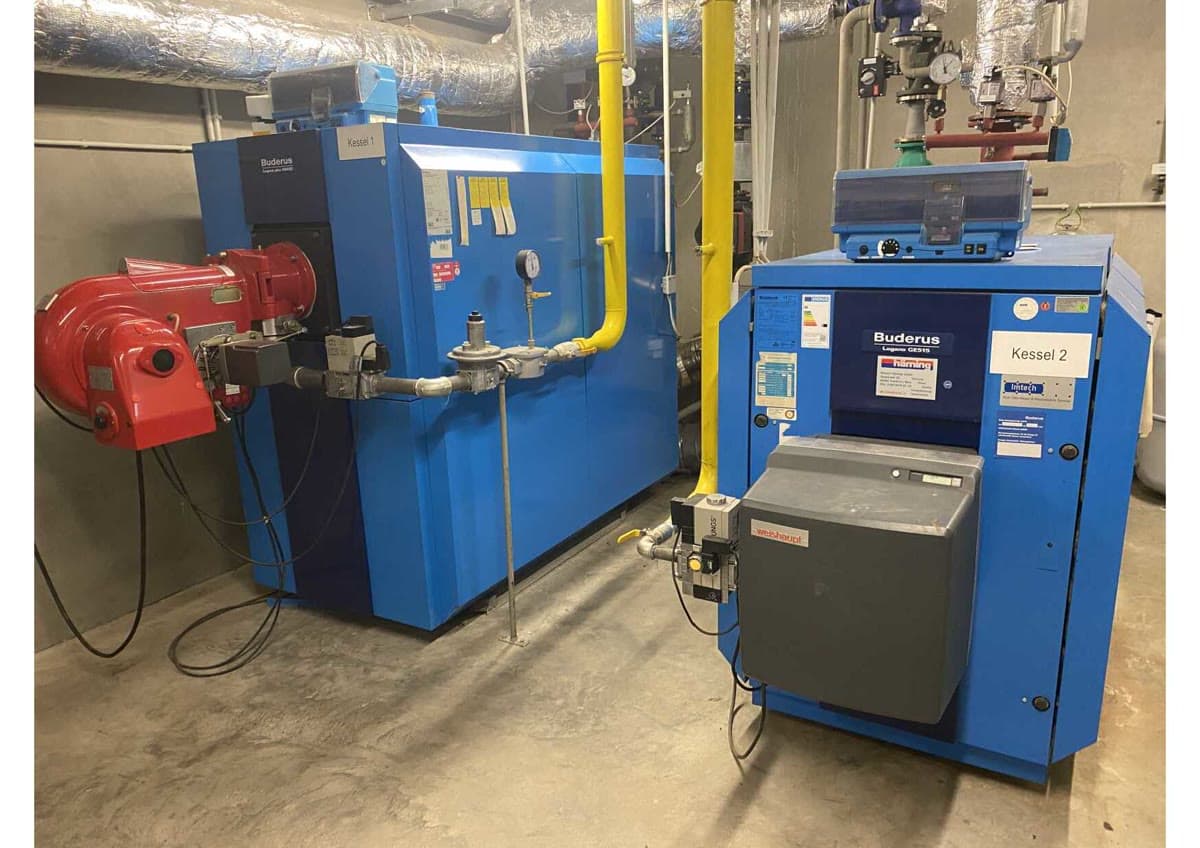
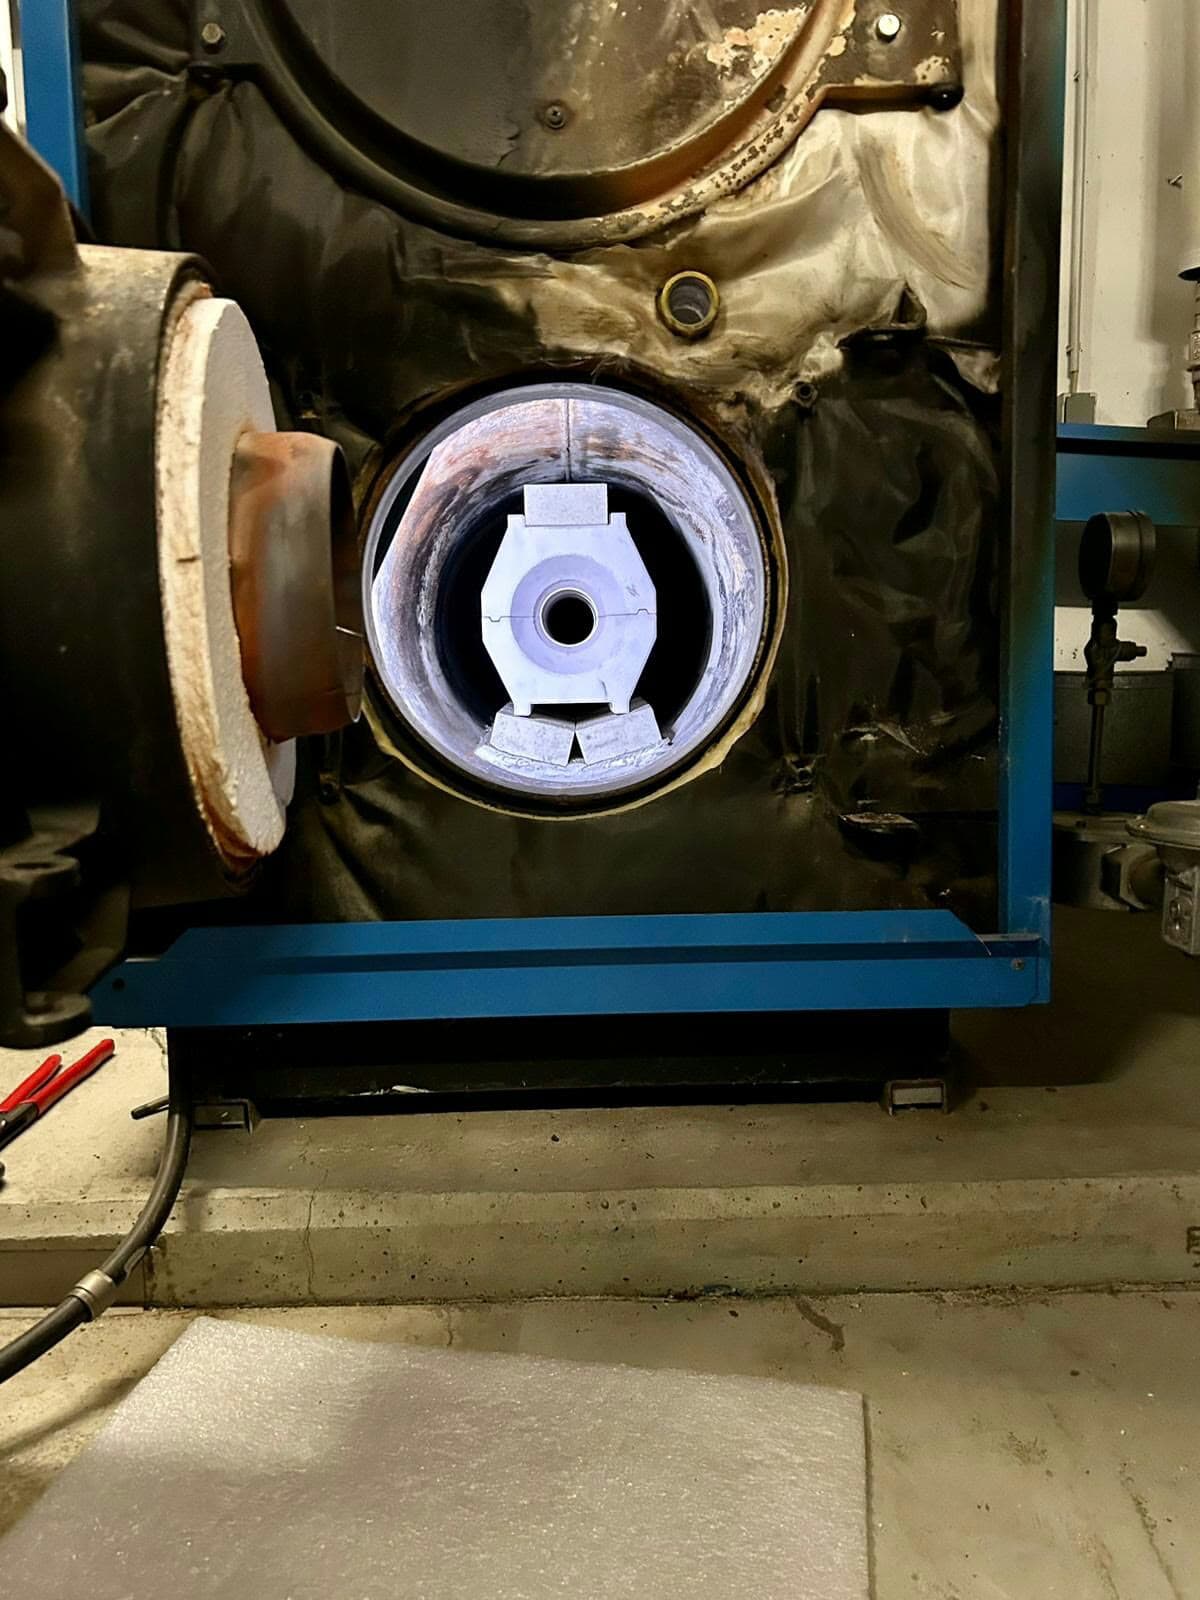
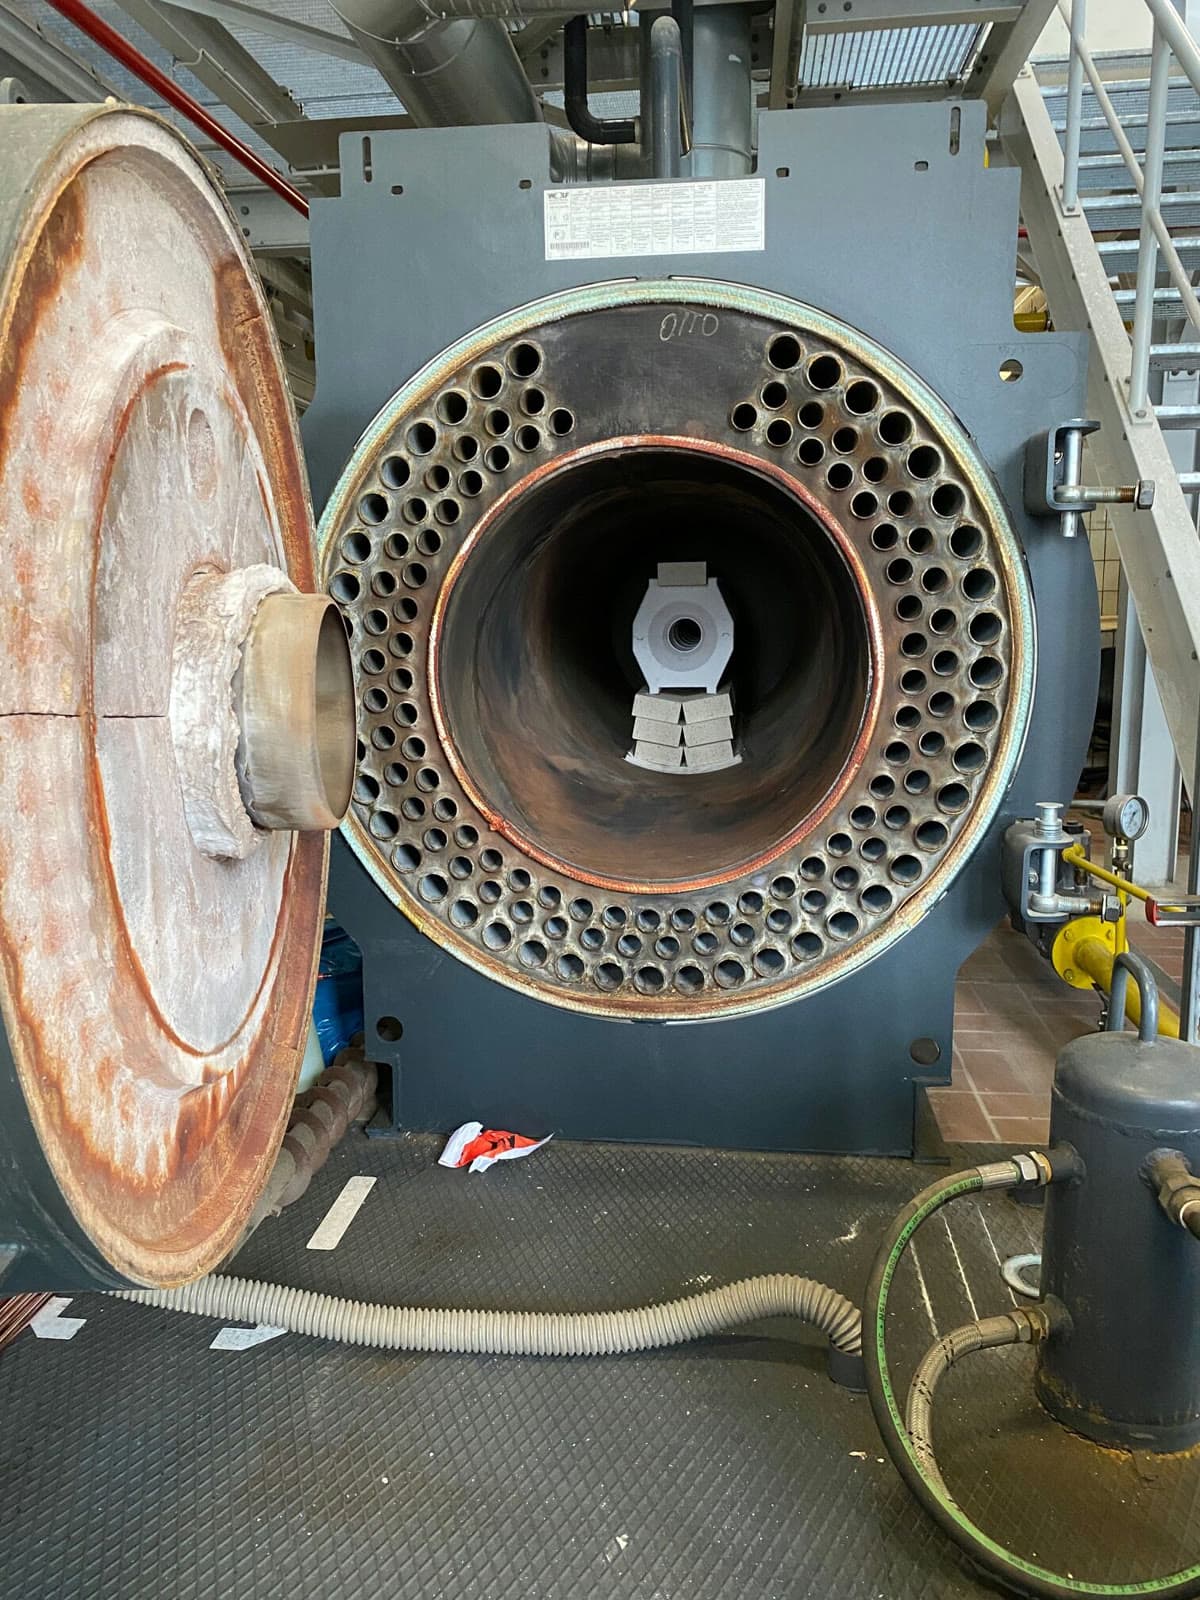
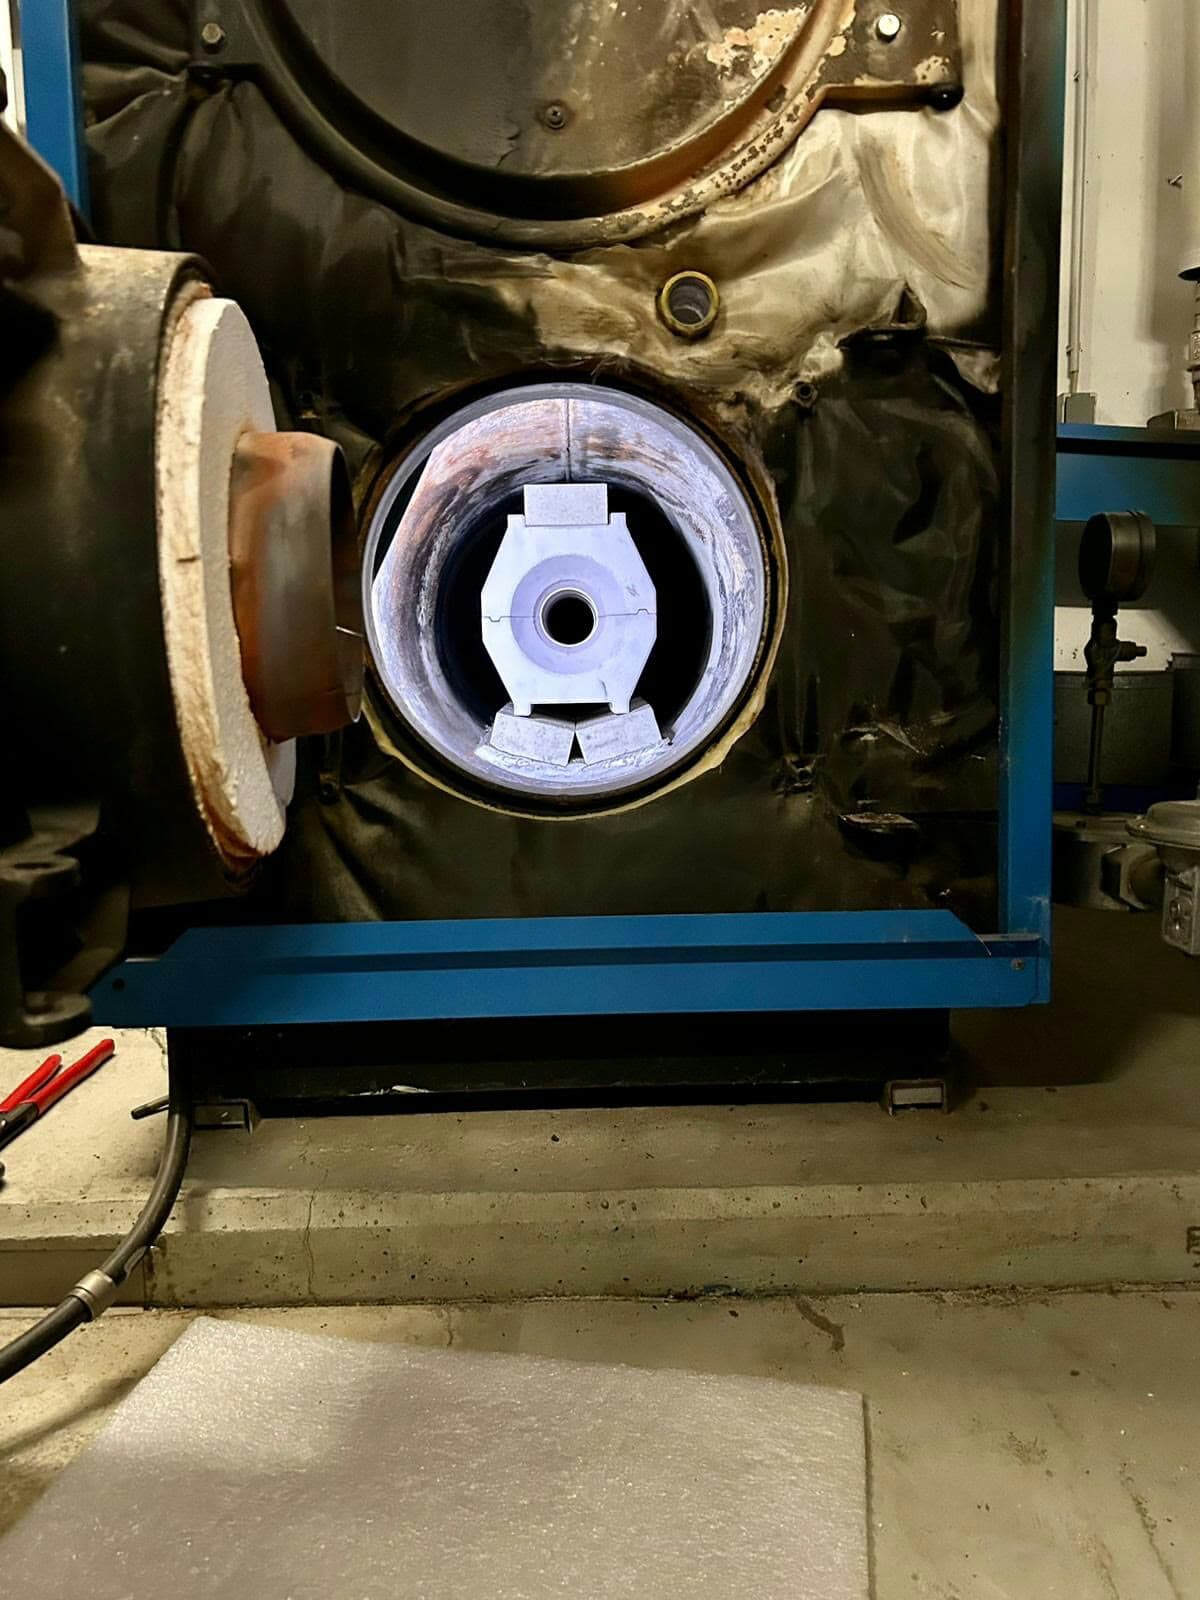
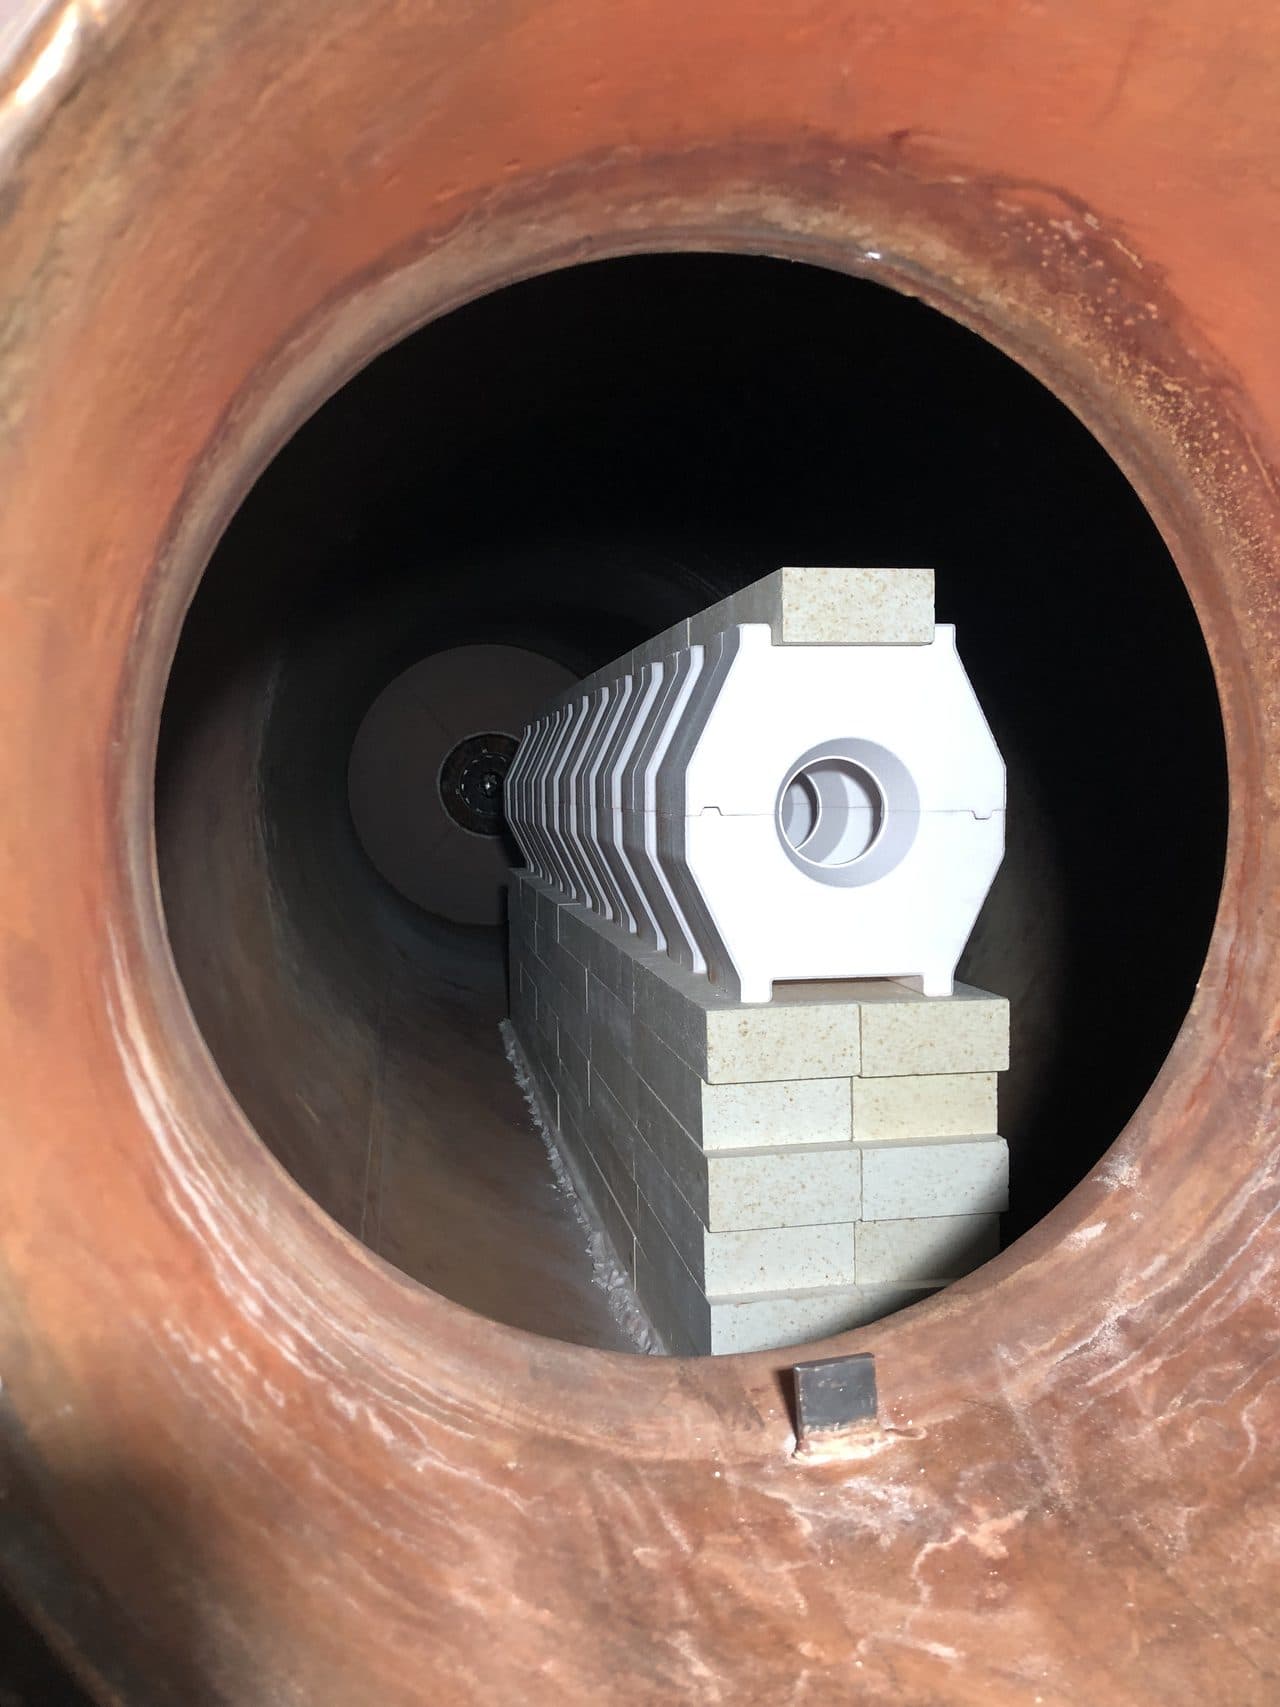
More installation photos are added continuously — every project is documented.
Talk to someone who already has it.
Numbers convince engineers, experience convinces operators. On request we arrange a call with an existing customer — operator to operator, engineer to engineer, with us staying out of it.
Request a reference call